Fig. 4 in Early giant reveals faster evolution of large body size in ichthyosaurs than in cetaceans
Description
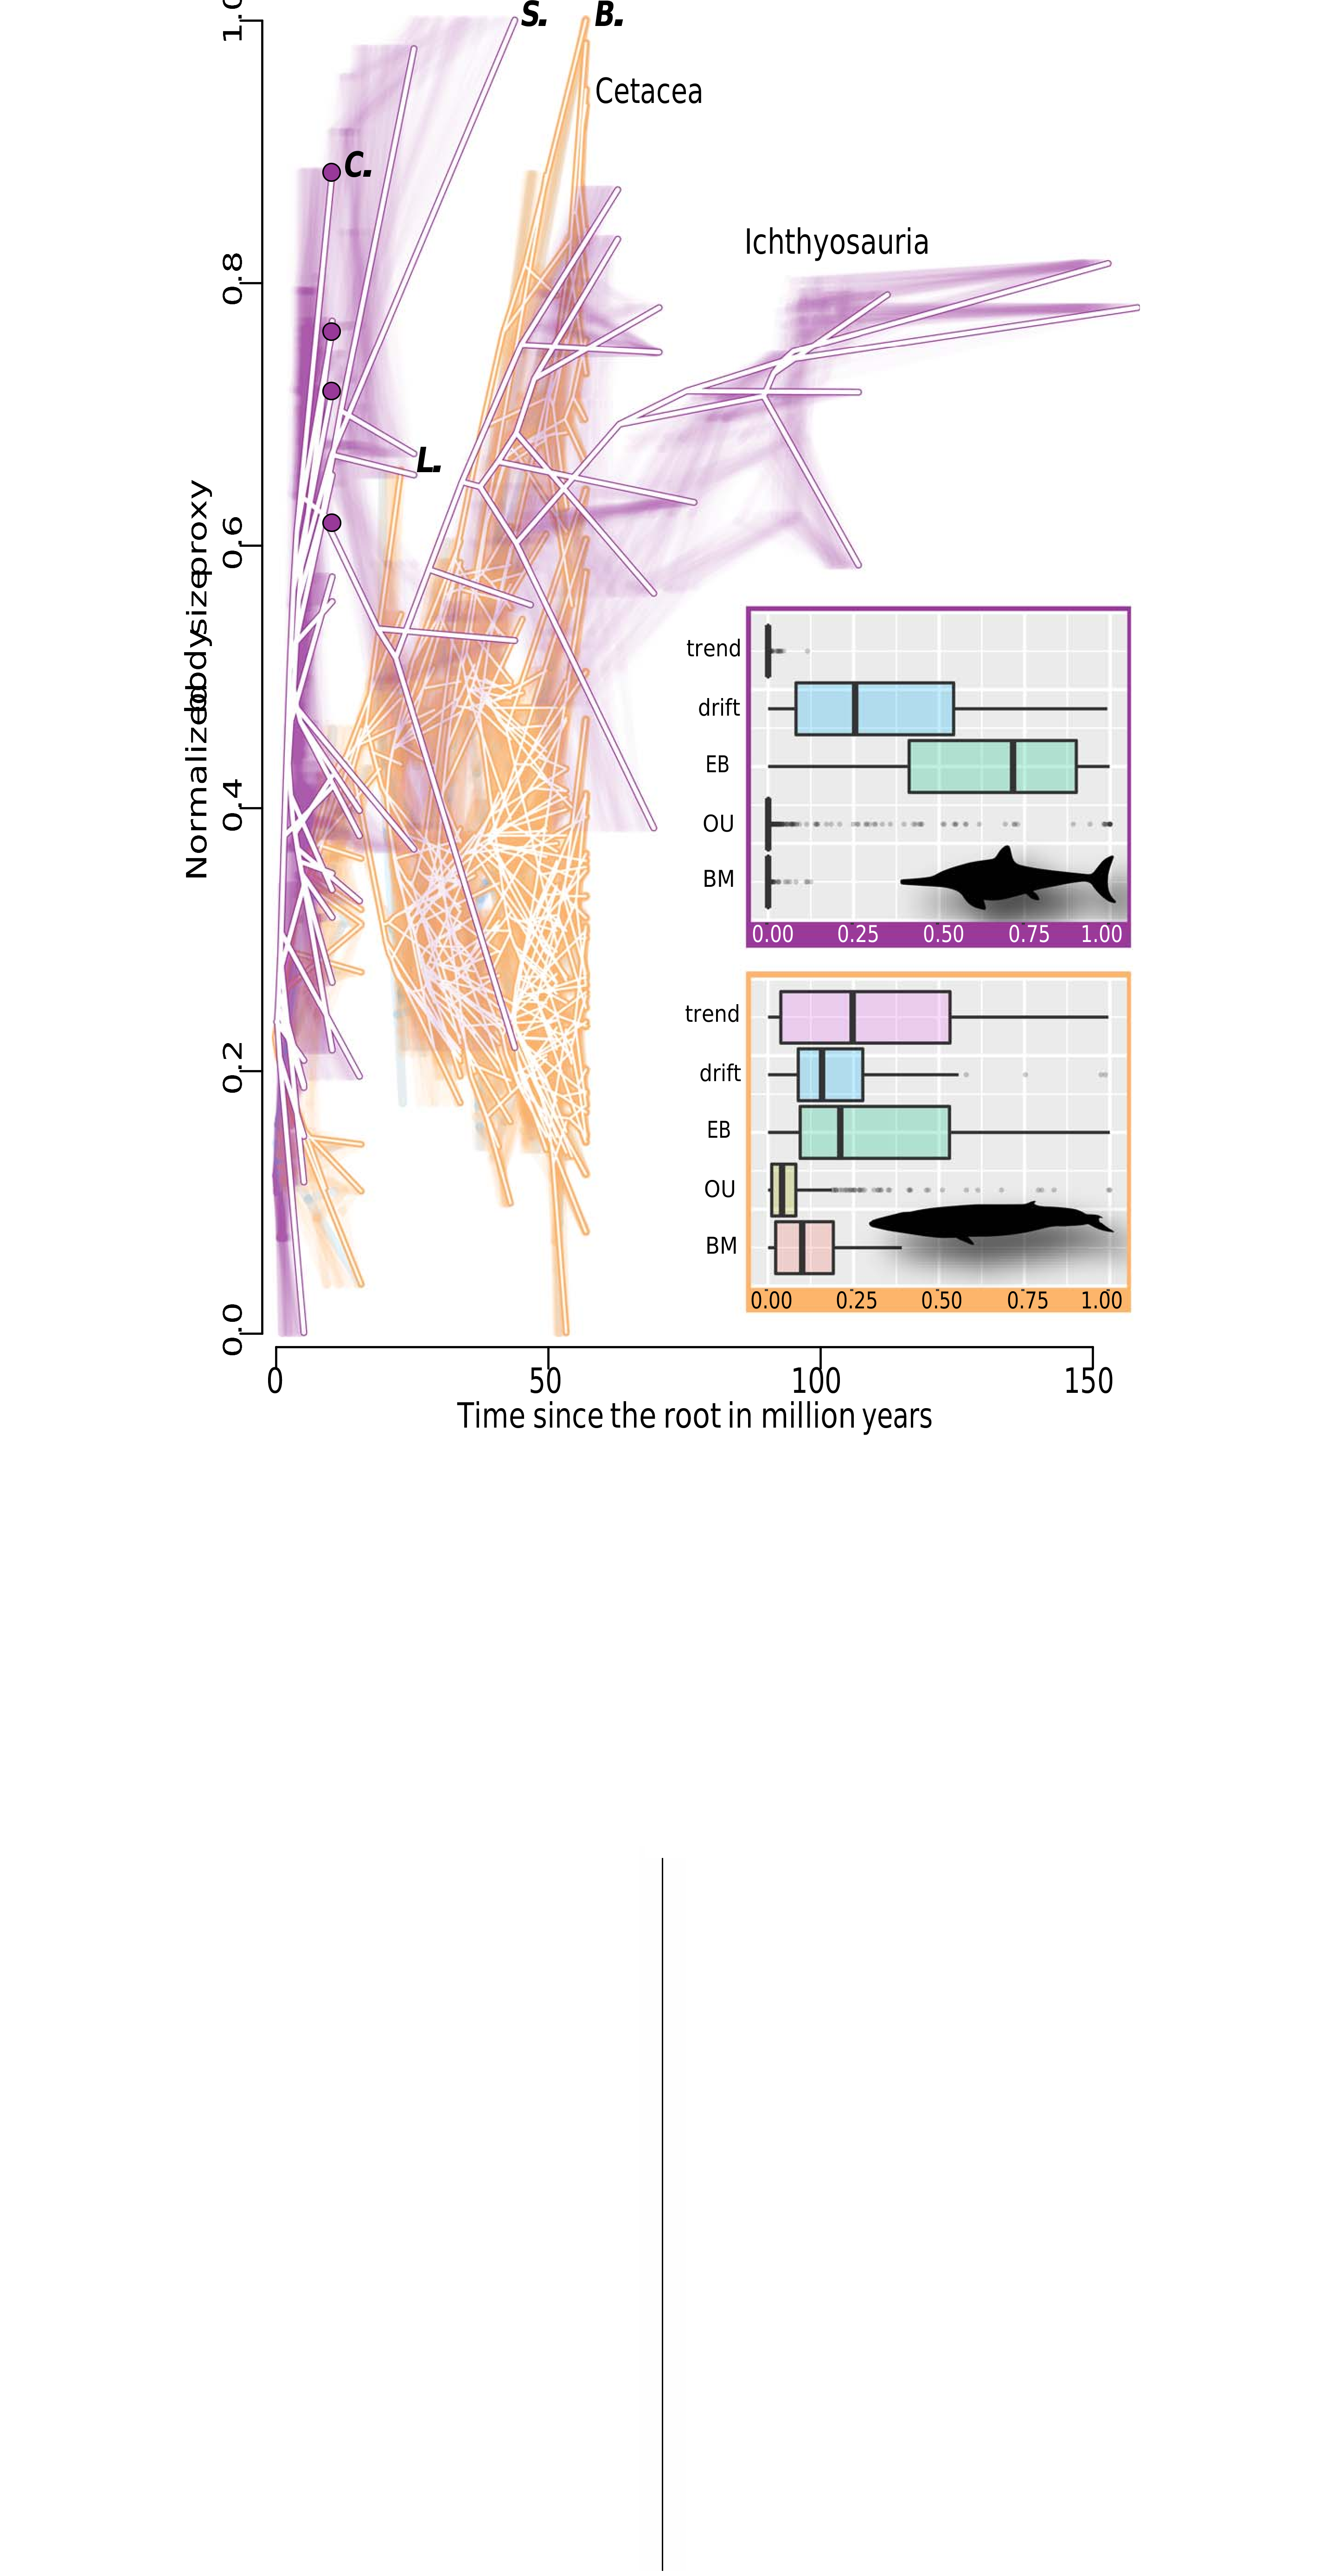
Fig. 4. Body-size evolution in ichthyosaurs and cetaceans compared. Traitgram of body size, normalized such that 0 corresponds to the smallest body size in each group and 1 to the largest for ichthyosaurs (lilac; based on an early-burst model) and cetaceans (ochre; based on a Brownian motion model) (see Methods). Lilac dots indicate Cymbospondylus species from the Fossil Hill Fauna. B., Balaenoptera musculus, blue whale; C., C. youngorum sp. nov.; L., Llanocetus denticrenatus, early giant baleen whale; S., S. sikanniensis, the largest named ichthyosaur. The inset shows model-fitting results expressed as Akaike weights for five different evolutionary models from 1000 iterations. Boxes represent the interquartile ranges (IQRs), with whiskers extending 1.5 times the IQR outside the boxes. Vertical lines inside the boxes show the median. BM, Brownian motion; EB, early burst; OU, Ornstein-Uhlenbeck.
Notes
Files
figure.png
Files
(1.8 MB)
| Name | Size | Download all |
|---|---|---|
|
md5:6f5dadb2ee6901ba2c57733c57f83df9
|
1.8 MB | Preview Download |
Linked records
Additional details
Related works
- Is part of
- Journal article: 10.1126/science.abf5787 (DOI)
- Journal article: urn:lsid:plazi.org:pub:FF88FF9B3839FFA665654B42FFAEA418 (LSID)
- Journal article: http://publication.plazi.org/id/FF88FF9B3839FFA665654B42FFAEA418 (URL)
- Journal article: https://zenodo.org/record/5805321 (URL)