Published March 15, 2025 | Version v2.0
Software Open

Propensity Score Matching (PSM) Python-based code

  • 1. EDMO icon University of Cantabria
  • 2. ROR icon Servicio Cántabro de Salud
  • 3. Instituto de Investigación Marqués de Valdecilla (IDIVAL)

Description

OVERVIEW / FINAL SUMMARY 

This repository provides 4 variants of a free, Python-based code for performing propensity score (PS) matching. An initiative of the Camargo Cohort Study (Cantabria, Spain), developed with the aim of sharing the tool and spreading the use of PS matching.

The code overcomes compatibility issues with R versions and R packages, and implements (i) logistic regression to compute PS, (ii) 1:N matching using the K-nearest neighbour (KNN) algorithm with a customisable caliper, (iii) sampling with or without replacement, (iv) visualisations to assess matching quality and (v) statistics to evaluate the balance.

Outputs:

  • Matched pairs stored as '.csv' file, allowing a Coxreg to be performed ('SET' in SPSS).
  • Diagnostic plots stored in the specified output folder, providing a view of SMD and PS distribution.
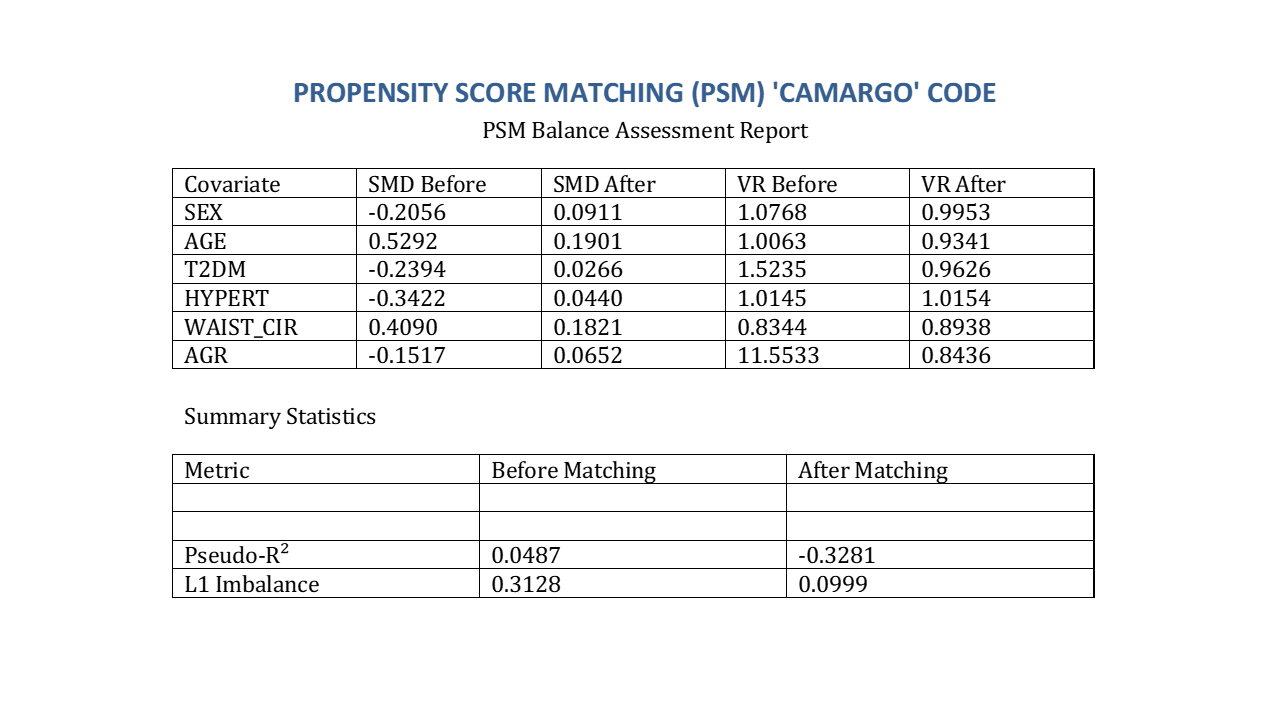
  • Statistics for matching validation: SMD, variance ratio (VR), McFadden's pseudo-R², and L1 multivariate imbalance.

The code has been developed using information from the Matplotlib, Numpy and Seaborn libraries and with OpenAI's ChatGPT support and refinements. 

No funding was received for conducting this work and there are no financial or non-financial interests to disclose. 


Table of contents

CODE

REPLACEMENT

CUSTOMISABLE RATIO AND CALIPER

MATCHED PAIRS

PSM ASSESSMENT

PS matching code 1

Without


Ratio: line 73

Caliper: line 84

.csv file

SMD (barplot and lineplot) (.png)

PS matching code 2

Without


Ratio: line 88

Caliper: line 89

.csv file

SMD, VR and pseudo-R² (.csv, .txt)

PS matching code 3

Without


Ratio: line 163

Caliper: line 168

.csv file

Lineplot with improvements (.png)

Balance report (SMD, VR, pseudo-R² and L1 imbalance) (.docx)


PS matching code 4

With


Ratio: line 89

Caliper: line 100

.csv file

SMD (barplot and lineplot) (.png)


Notes

Some tips
It has been tested and runs:
(i) Using SPSS v25 with R 3.3.3 and Python >3.10 correctly installed (Check Python in Edit / Options / File locations, and in System/Environment variables). Click in File/Open/Script Python, select it and the script will appear in an IDLE window. Run Module.
(ii) Using RStudio with R >4.3 and Python >3.10 as interpreter (Tools / Global options / Python). You only need SPSS just for the path to your dataset and to incorporate covariates to the PSmodel (in capital letters and names, do not use the labels).
 
It tolerates missing values acceptably. However, it is desirable to reduce them as much as possible.
It is highly recommended to check if the Python modules are available, especially 'pyreadstat' and 'Python-docx', necessary for code 3. To be sure, install them all (numpy, pandas, logging, os, statmodels, sklearn, matplotlib, seaborn, Python-docx), better from RStudio console: library(reticulate) / py_install("pyreadstat", envname = "~/.virtualenvs/r-reticulate"), than from Powershell.
Look for indentation errors if the code does not work.
 
Usage:
Refine the code with your current research:
- The first choice, sampling with or without replacement. By default, Python modules perform sampling without replacement. If you decide with replacement, use the code 4.
- Rename C:\XXXXXXXXXXX with the path to your dataset (.sav)
- Rename COVS (covariates intended to estimate PS) 
- Choose the ratio (1:1, 1:2...) and the caliper 
- Choose bar colors,  adjust the limits of the x-axis and y-axis to the desired range...
- Rename C:\XXXXXXXXXX with the path to your folder where the outputs will be stored
Run the script.

Notes

Assessment of the matching process / Validation

The matching quality can be rated by using the following recommended statistics:

  • Standardized mean difference: After matching, between -0.1 and 0.1
  • Variance ratio: Ater matching, close to 1
  • McFadden's pseudo-R²: After matching, close to 0
  • L1 multivariate imbalance: L1 is a measure of multivariate imbalance bounded by 0 (perfect balance) and 1 (complete separation in the cross-tabulation). It is desirable for L1 to be smaller in the matched sample than in the unmatched sample. 

The four tests examine all the covariates used to estimate the PS as well as the variables defined by the user as additional covariates. When running these statistics, sampling without replacement, ratio 1:1 and caliper=0.20 are applied by default. 

The results are provided as a diagnostic plot (SMD), as separate files or gathered in a Balance Report (code 3).

Notes

Comparison between Python-based code and PSM performed by SPSS (based on R packages)

The code has been tested by comparing the results with those of a PSM in SPSS based on R packages (Propensity Score Matching for SPSS v1.0, by Thoemmes F). We selected 5 covariates to estimate the PS, caliper=0.20, ratio 1/1, sampling without replacement, and applied them on the same dataset with both methods. We observed significant discrepancies in the PS values and in the composition of the matched sample. The differences were probably due to several factors -PS estimation, optimisation algorithms, caliper application...- reflecting the different performances offered by Python libraries (matplotlib, sklearn) and R-based packages (MatchIt, RItools, cem).

However, as shown in the file, the SMD were virtually identical by using both methods. Given that SMD is the most recognized statistic in terms of balance assessment, this result validates our approach and shows that the Python implementation is reliable.

Notes

Final comments

Given the growing use of PSM and the known compatibility issues between versions of SPSS, R and the R packages on which PSM relies, the primary objective of this initiative was to develop a Python-based script that could be implemented regardless of the version of SPSS and R. The tool should be complete, well-validated and easy to implement, with the intention of making it available to clinicians and researchers.

Secondary objectives were to produce a matched sample of identified pairs and a well structured balance report. PSM for SPSS v1.0 - the only version we were able to get running - provides a matched sample, but the pairs are not identified, and this information is crucial for running a COXREG. Regarding the Balance report, after discarding the Overall balance due to the lack of a broad consensus, it encompasses the recommended statistics, and we consider it as an achievement. 

Finally, an unexpected finding. The colour assignment in the lineplot, based on whether a covariate is included in the PS, has shown that PSM can also indirectly reduce the SMD of covariates not explicitly included in the PS model, likely due to underlying correlations or associations.

Files

Balance report.png

Files (637.6 kB)

Name Size Download all
md5:639de8079996405e2be0ad0386d68b2a
25.5 kB Preview Download
md5:8441fbe8e7fca32b1a0b65d7519170f1
254.0 kB Download
md5:25c29a4ed1f97164ab6865eaa80df1fe
10.4 kB Download
md5:5436ae051adcf047b4309bd09e37084f
7.7 kB Download
md5:478d4a7a27e12647081563fe596ffa53
10.2 kB Download
md5:8c1af0c66f3d8b954af24e5a1fe51827
10.8 kB Download
md5:982012e6073b69e9e64d02a06fbd209b
60.2 kB Preview Download
md5:4132dcd992a4e6a273ce3662a9a4297d
47.2 kB Preview Download
md5:52b1125472fe0760979c7efe0ccea770
75.8 kB Preview Download
md5:88295d3cb5ce0b60e853d61ccfe6442f
135.8 kB Preview Download

Additional details

Additional titles

Alternative title
SUMMARY

Dates

Updated
2025-03-03
Python-based code for implementing PSM

Software

References

  • Staffa SJ, Zurakowski D. Five Steps to Successfully Implement and Evaluate Propensity Score Matching in Clinical Research Studies. Anesth Analg. 2018;127:1066-1073. doi: 10.1213/ANE.0000000000002787.
  • Thoemmes, F. Propensity score matching in SPSS. 2012. Available at: https://arxiv.org/pdf/1201.6385.
  • Stuart EA. Matching methods for causal inference: A review and a look forward. Stat Sci. 2010;25:1-21. doi: 10.1214/09-STS313.
  • Brookhart MA, Schneeweiss S, Rothman KJ, Glynn RJ, Avorn J, Stürmer T. Variable selection for propensity score models. Am J Epidemiol. 2006;163:1149-56. doi: 10.1093/aje/kwj149.
  • Austin PC. An Introduction to Propensity Score Methods for Reducing the Effects of Confounding in Observational Studies. Multivariate Behav Res. 2011 May;46(3):399-424. doi: 10.1080/00273171.2011.568786.
  • Zhang Z, Kim HJ, Lonjon G, Zhu Y; written on behalf of AME Big-Data Clinical Trial Collaborative Group. Balance diagnostics after propensity score matching. Ann Transl Med. 2019 Jan;7(1):16. doi: 10.21037/atm.2018.12.10.