Published December 31, 2014
| Version v1
Figure
Open
Fig. 6 in Good Reasons and Guidance for Mapping Planktonic Protist Distributions
Creators
Description
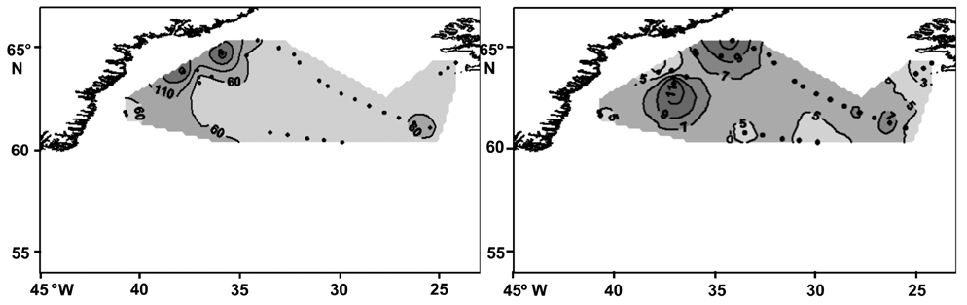
Fig. 6. Patches of total phytoplankton biomass (ng C ml–1, left) and total ciliate abundance (cells ml–1, right) in the Irminger Sea, North Atlantic. The spatial coincidence indicates a potential prey-predator relationship.
Notes
Files
figure.png
Files
(65.7 kB)
| Name | Size | Download all |
|---|---|---|
|
md5:b98cee44153b55e29ffd3530d4b55570
|
65.7 kB | Preview Download |
Linked records
Additional details
Related works
- Is part of
- Journal article: 10.4467/16890027AP.14.003.1440 (DOI)
- Journal article: urn:lsid:plazi.org:pub:5877FFD2FFCDFF9B61182C34FF822877 (LSID)
- Journal article: https://zenodo.org/record/8377567 (URL)