Harmonized Vegetation Continuous Fields (VCF)

Description
Motivation
Song’s Vegetation Continuous fields (VCF) product, based on AVHRR satellite data, is the longest time-series of its type, but lacks updates past 2016 due to the extensive degradation of the sensor. We used machine learning to extend this time-series using data from the Copernicus Land Cover dataset, which provides per-pixel proportions of different land cover classes between 2015 and 2019. In addition, we included MODIS VCF data.
Content
This repository contains the infrastructure used to model Song-like VCF data past 2016. This infrastructure contains a yaml file that configures the modelling framework (e.g. variables, directories, hyper-parameter tuning), and that interacts with a standardized folder structure.
Modelling approach
Song's VCF dataset includes data on generic categories, namely “tree cover”, “non-tree vegetation”, and “non vegetated”. Given the Copernicus dataset has a higher thematic detail, we first aggregated these data into comparable classes. We created a “Non-tree vegetation” layer (i.e. total per-pixel proportion of crops, grasses, shrubs, and mosses), and a “Non Vegetated” layer (i.e. total per-pixel proportion of bare land, permanent water, urban, and snow). Independent data on “Tree cover” was already present.
We then constructed a Random Forest Regression (RFReg) model to predict Song-like VCF layers between 2016 and 2019. The predictions were informed by variables on topography, climate, and fires (which limit the density of vegetation), and by variables on differences between the Copernicus VCF and MODIS-based VCF data. Because MODIS data is available past 2016, its inclusion informs our models on how MODIS data, and their differences compared to Copernicus data, relate to the values reported in Song's data.
Sampling scheme
For each VCF category, we collected samples on a country-by-country basis. Within each country, we estimated the difference in percent cover between the Song's and Copernicus VCF data, and sampled across a gradient of differences, from -100% (no cover in AVHRR and full cover in Copernicus) to +100% (full cover in AVHRR and no cover in Copernicus). We iterated through this range in intervals of 10% and sampled across a gradient of “tree cover”, “non-tree vegetation”, and “non vegetated”, in intervals of 10% from 0% to 100%. We collected at least one sample per 50 km2 in 2016, the last year where all VCF-related variables (Song's, Copernicus, MODIS) are available simultaneously. The amount of samples attributed to each range of differences is proportional to the area covered by this range within the country of reference. The sampling approach was repeated for each VCF class, and the outputs were later combined into a single set of samples that exclude duplicates, resulting in 238,052 samples.
Validation
The model outputs were validated using leave-one-out cross-validation. For each VCF class, the validation framework iterates through each country where samples were collected, excluding it for validation and using the remaining samples to train a RFReg models.This resulted in R2 values of 0.91, 0.87 and 0.91 for “tree cover”, “non-tree vegetation”, and “non vegetated”. respectively. The RMSE values were of 2.31%, 3.05%, and 2.25%.
The model was applied to data from 2015, which was not used to neither predict nor validate our models. A comparison between the 2015 Song data against our predictions, which consist of 8,764,232 pixels, yielded R2 values of 0.94, 0.91, and 0.97. The RMSE were 6.65%, 8.92%, and 5.96%. Additionally, we compared changes between 2015 and 2016, resulting in RMSE values of 2.83%, 3.69%, and 2.57%.
Post-processing
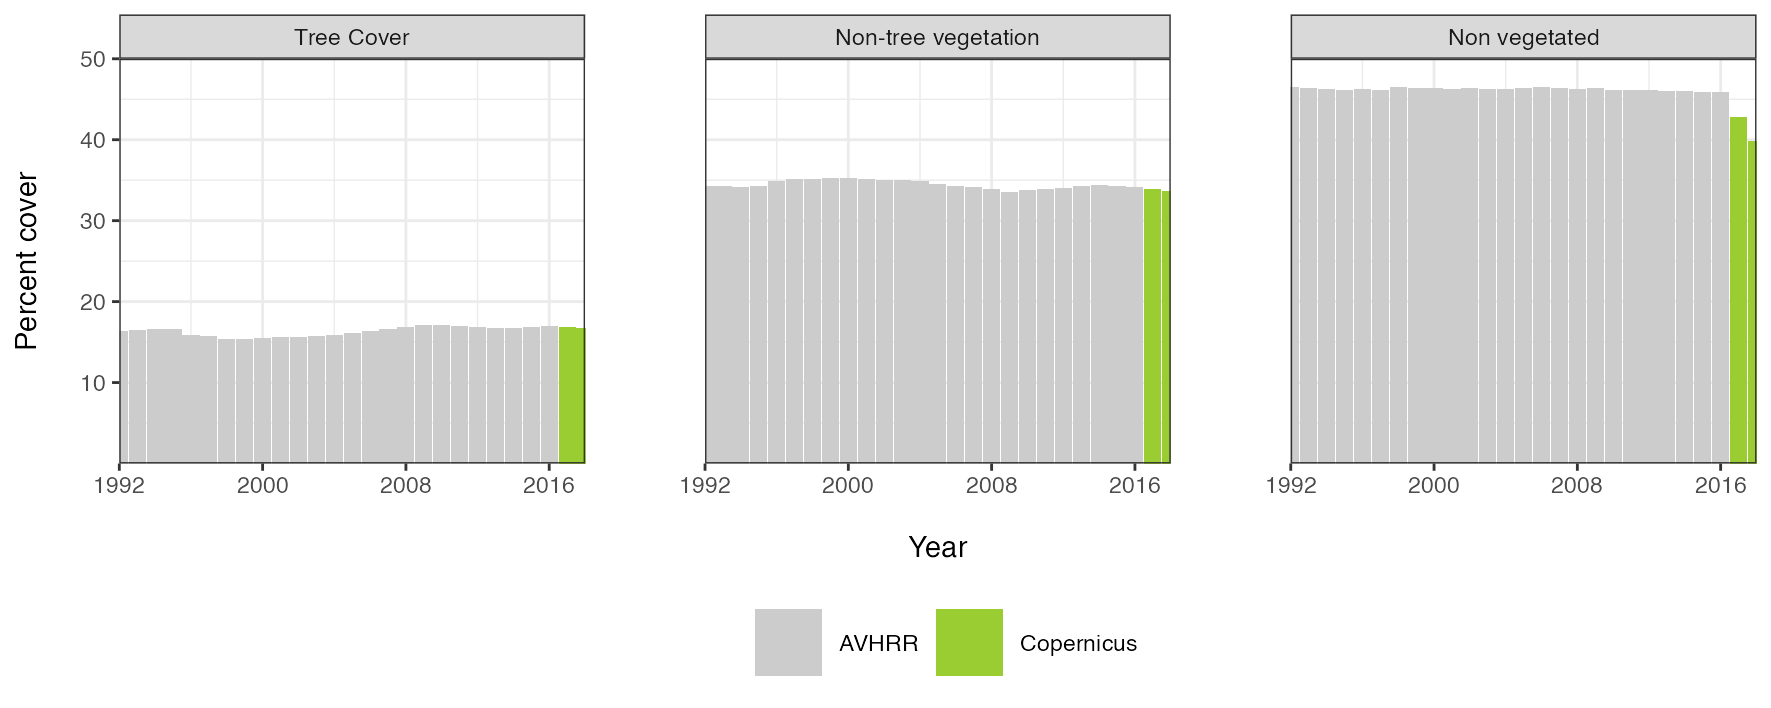
When observing annual VCF time-series based on Song's data, we noted that our predictions were the most plausible for “tree cover” and “non-tree vegetation”. In turn, our “non vegetated” are seemingly underestimated (see "temporal_trend_check.png"), reporting large year-to-year decreases om cover (-3.05% between 2016 and 2017, compared to -0.14% for "tree cover" and -0.26% for “non-tree vegetation”). To address this issue, we recommend deriving data on “non-vegetated” cover by computing the difference between 100% and the sum of "tree cover” and “non-tree vegetation”.
Files
temporal_trend_check.png
Files
(2.8 GB)
| Name | Size | Download all |
|---|---|---|
|
md5:dde2f1ac4e10b97a00f3fae4c6f2b02b
|
33.5 kB | Preview Download |
|
md5:392ba26881bce682fbf010fcdaa4819a
|
2.8 GB | Preview Download |