High resolution cropland agreement map (30 m) circa 2020
Creators

- 1. Statistics Division, United Nations Food and Agriculture Organization
- 2. Digitization and Informatics Division, United Nations Food and Agriculture Organization
- 3. International Institute for Applied Systems Analysis
- 4. Geospatial Unit, Land and Water Division, United Nations Food and Agriculture Organization
Description
Accurate and precise measurements of global cropland extent are needed for monitoring the sustainability of agriculture at all scales. Recent advancement in remote sensing and land cover mapping methods have greatly increased the ability to estimate cropland area distribution and trends. Here the FAO presents a map of cropland agreement produced by consolidating information at pixel level from six high-resolutions maps for circa 2020. The following six high resolution layers were used: ESRI 10 meter LU/LC, FROM-GLC, GLAD, GLC-FCS30, Globeland30 and Worldcover.
Two bands are included in the dataset:
- Simple agreement (values between 1 and 6)
- Detailed agreement (values between 1 and 63)
The map, developed in the Google Earth Engine platform, combines the 6 land cover/cropland layers to show their cropland agreement on pixel level at a spatial resolution of 30 meters. The simple agreement has pixel values that range from 1 (only 1 dataset classifies as cropland) to 6 (all datasets agree on presence of cropland). Pixels with a value of 0 indicate pixels where all datasets agree on absence of cropland. The second band includes a detailed agreement, showing which combination of the 6 datasets classify a pixel as cropland. The overview table (DetailedAgreement_LookupTable.xlsx) shows what the pixel values of this detailed agreement (from 1 to 63) correspond to.
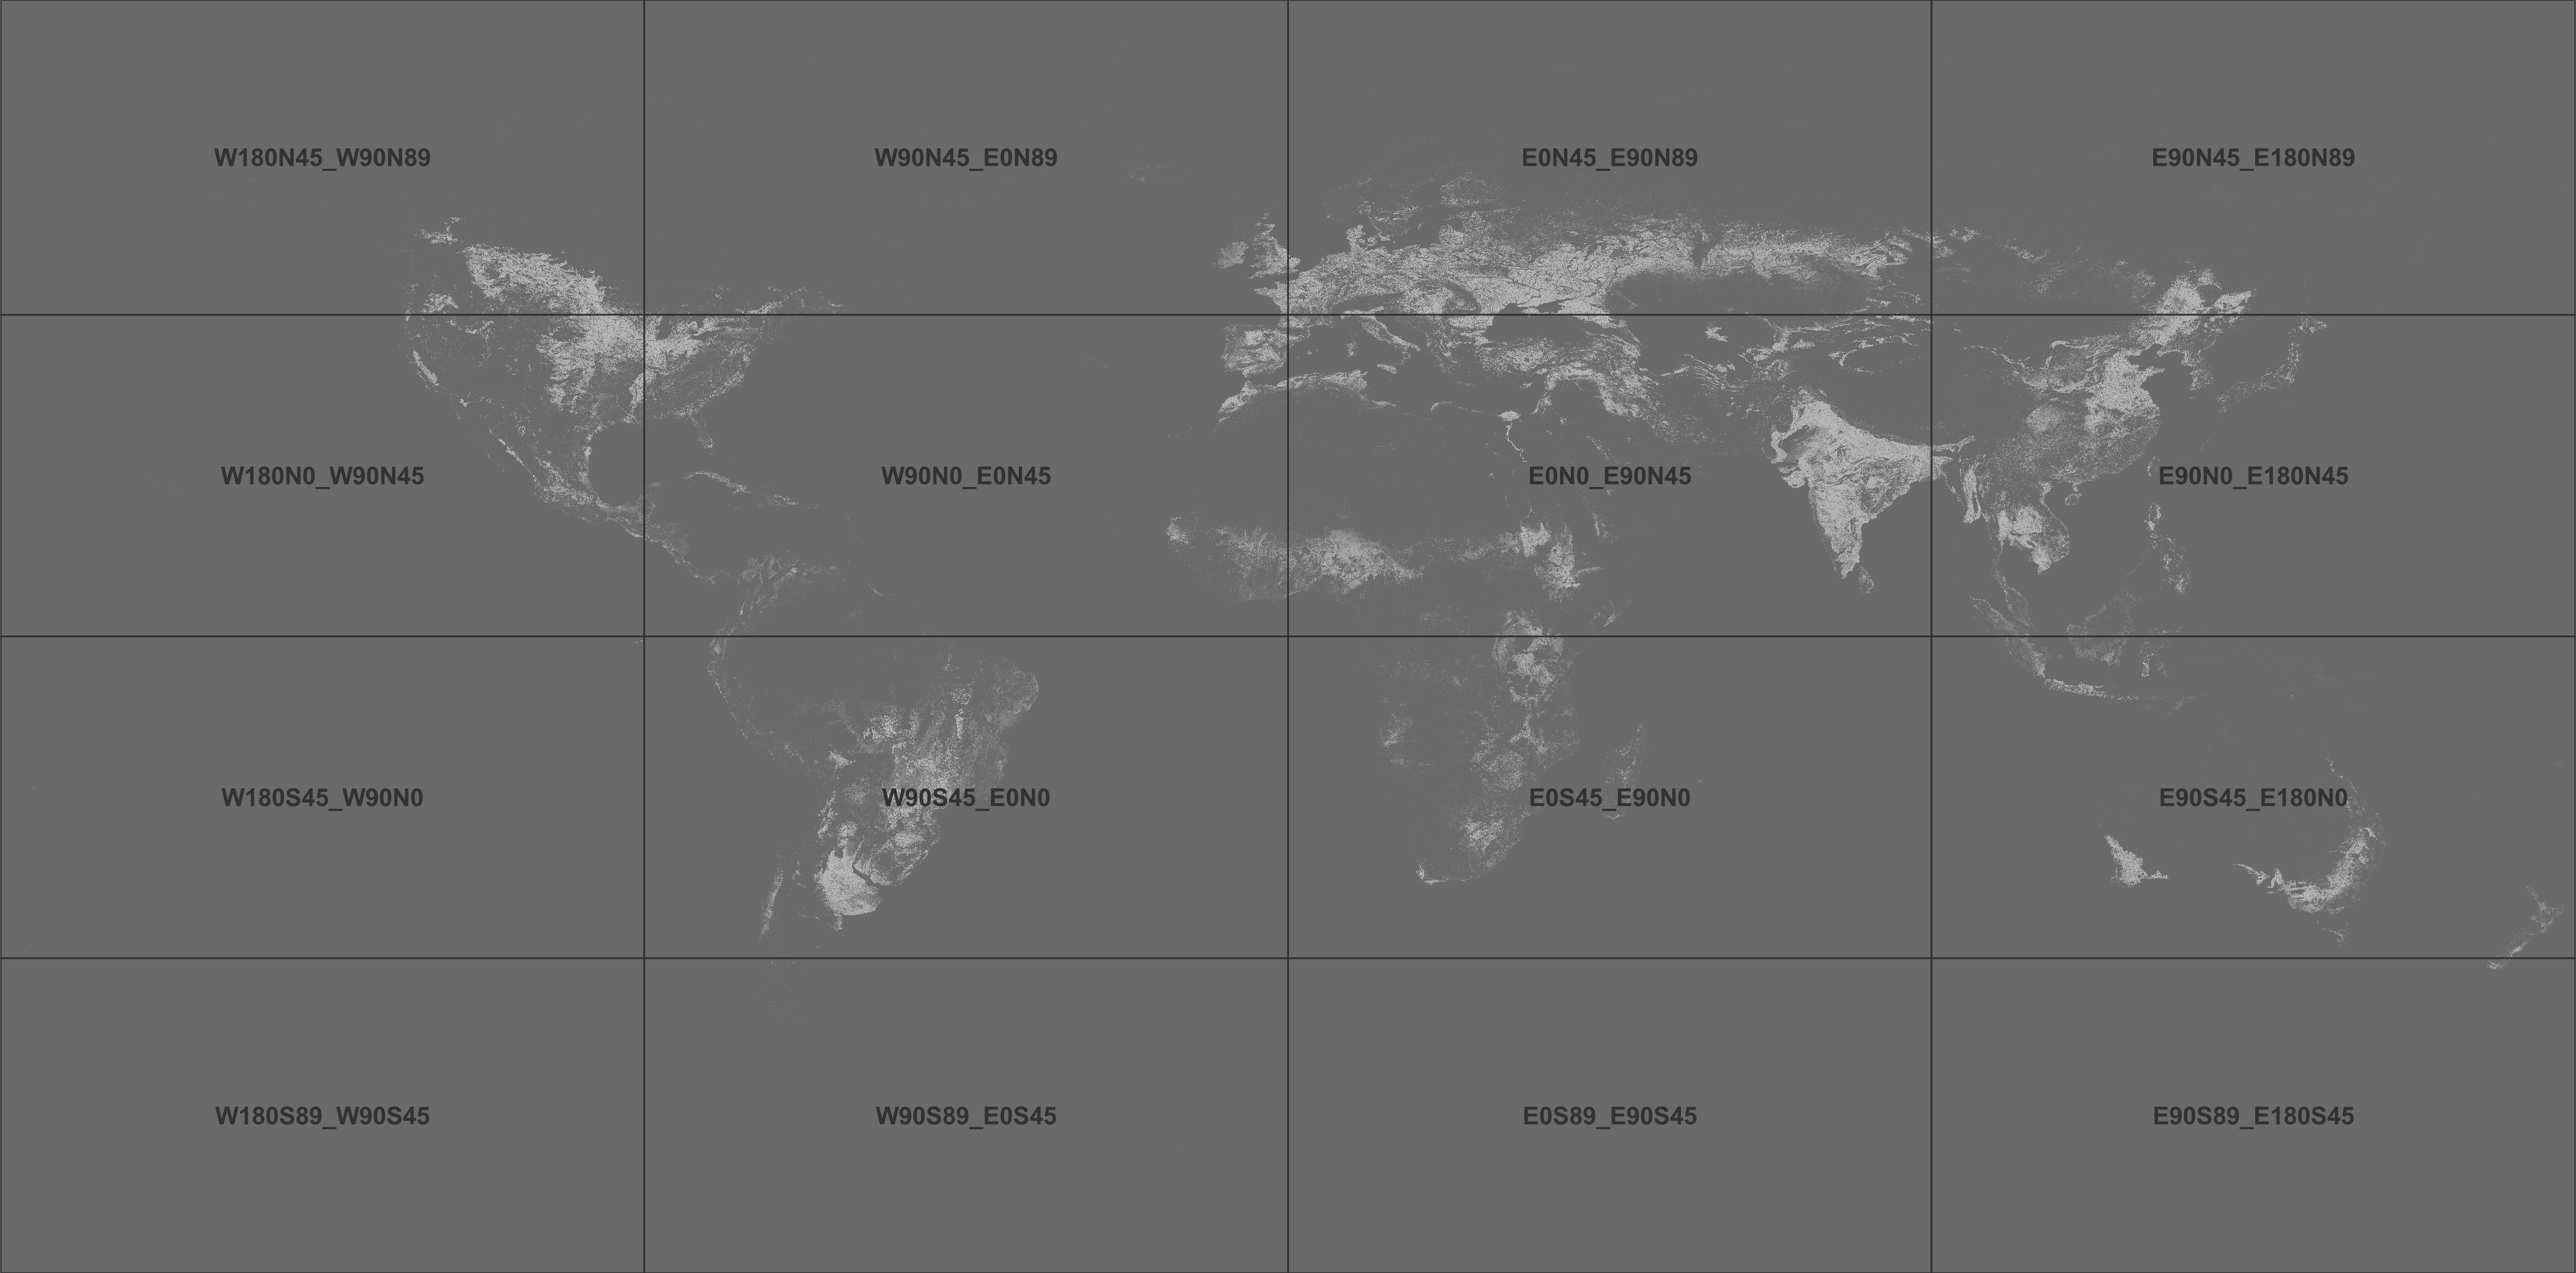
The dataset has been uploaded in 16 tiles, in the preview below and in the file "ACroplandAgreement_30m_Tiles.png" the extent of each tile can be found.
For more information on FAO statistics on land cover and land use:
FAO. 2022. Land use statistics and indicators. Global, regional and country trends, 2000–2020. FAOSTAT Analytical Brief, no. 48. Rome. https://doi.org/10.4060/cc0963en
FAO. 2021. Land cover statistics. Global, regional and country trends, 2000–2019. FAOSTAT Analytical Brief Series No. 37. Rome.
Files
ACroplandAgreement_30m_Tiles.png
Files
(21.4 GB)
| Name | Size | Download all |
|---|---|---|
|
md5:12f120eb7e5f9ce17ab12ecc56731e5b
|
1.1 MB | Preview Download |
|
md5:8e15d93d3d13d11f2f8e9bab438549d0
|
4.9 GB | Preview Download |
|
md5:7b0c9c2c62baf589d7ce5eee922c49de
|
2.8 GB | Preview Download |
|
md5:ff547474c16281cb49f178d68a218d7b
|
1.7 GB | Preview Download |
|
md5:66529fac09b490871b30b8b9d0e9e284
|
110.7 MB | Preview Download |
|
md5:7b9dcb247571a521467ca4621ae4e039
|
3.3 GB | Preview Download |
|
md5:df70be32686c91c06410363d37f9bf8b
|
598.1 MB | Preview Download |
|
md5:85721ca34a56e49dd43471059ba78281
|
920.3 MB | Preview Download |
|
md5:5e244ee0d198eb17cb09676e737fd129
|
121.0 MB | Preview Download |
|
md5:ce98ee59423dada286030a4e7df7f720
|
1.4 GB | Preview Download |
|
md5:6d7ca6fce21483b8b9a33af1cf5170ad
|
699.2 MB | Preview Download |
|
md5:f2e9648182adb8220ce13cf50fc0b2dd
|
113.8 MB | Preview Download |
|
md5:168c02d539957c577d3a8b5900fac3c7
|
110.8 MB | Preview Download |
|
md5:3aae29cdd373b61aef595b9d8c43ce37
|
1.9 GB | Preview Download |
|
md5:92c8da32c5d1febb075f6b48ce150cc2
|
412.6 MB | Preview Download |
|
md5:9c48dcb519a016089b7e712f47455aa9
|
2.1 GB | Preview Download |
|
md5:ee19e9d82fb13450ee03bbabcd29fac8
|
113.7 MB | Preview Download |
|
md5:58c28ae37959f5bc8f8560bd17096a95
|
20.0 kB | Download |