Published June 21, 2017
| Version v1
Figure
Open
Figure 2 in Host and viral traits predict zoonotic spillover from mammals
Description
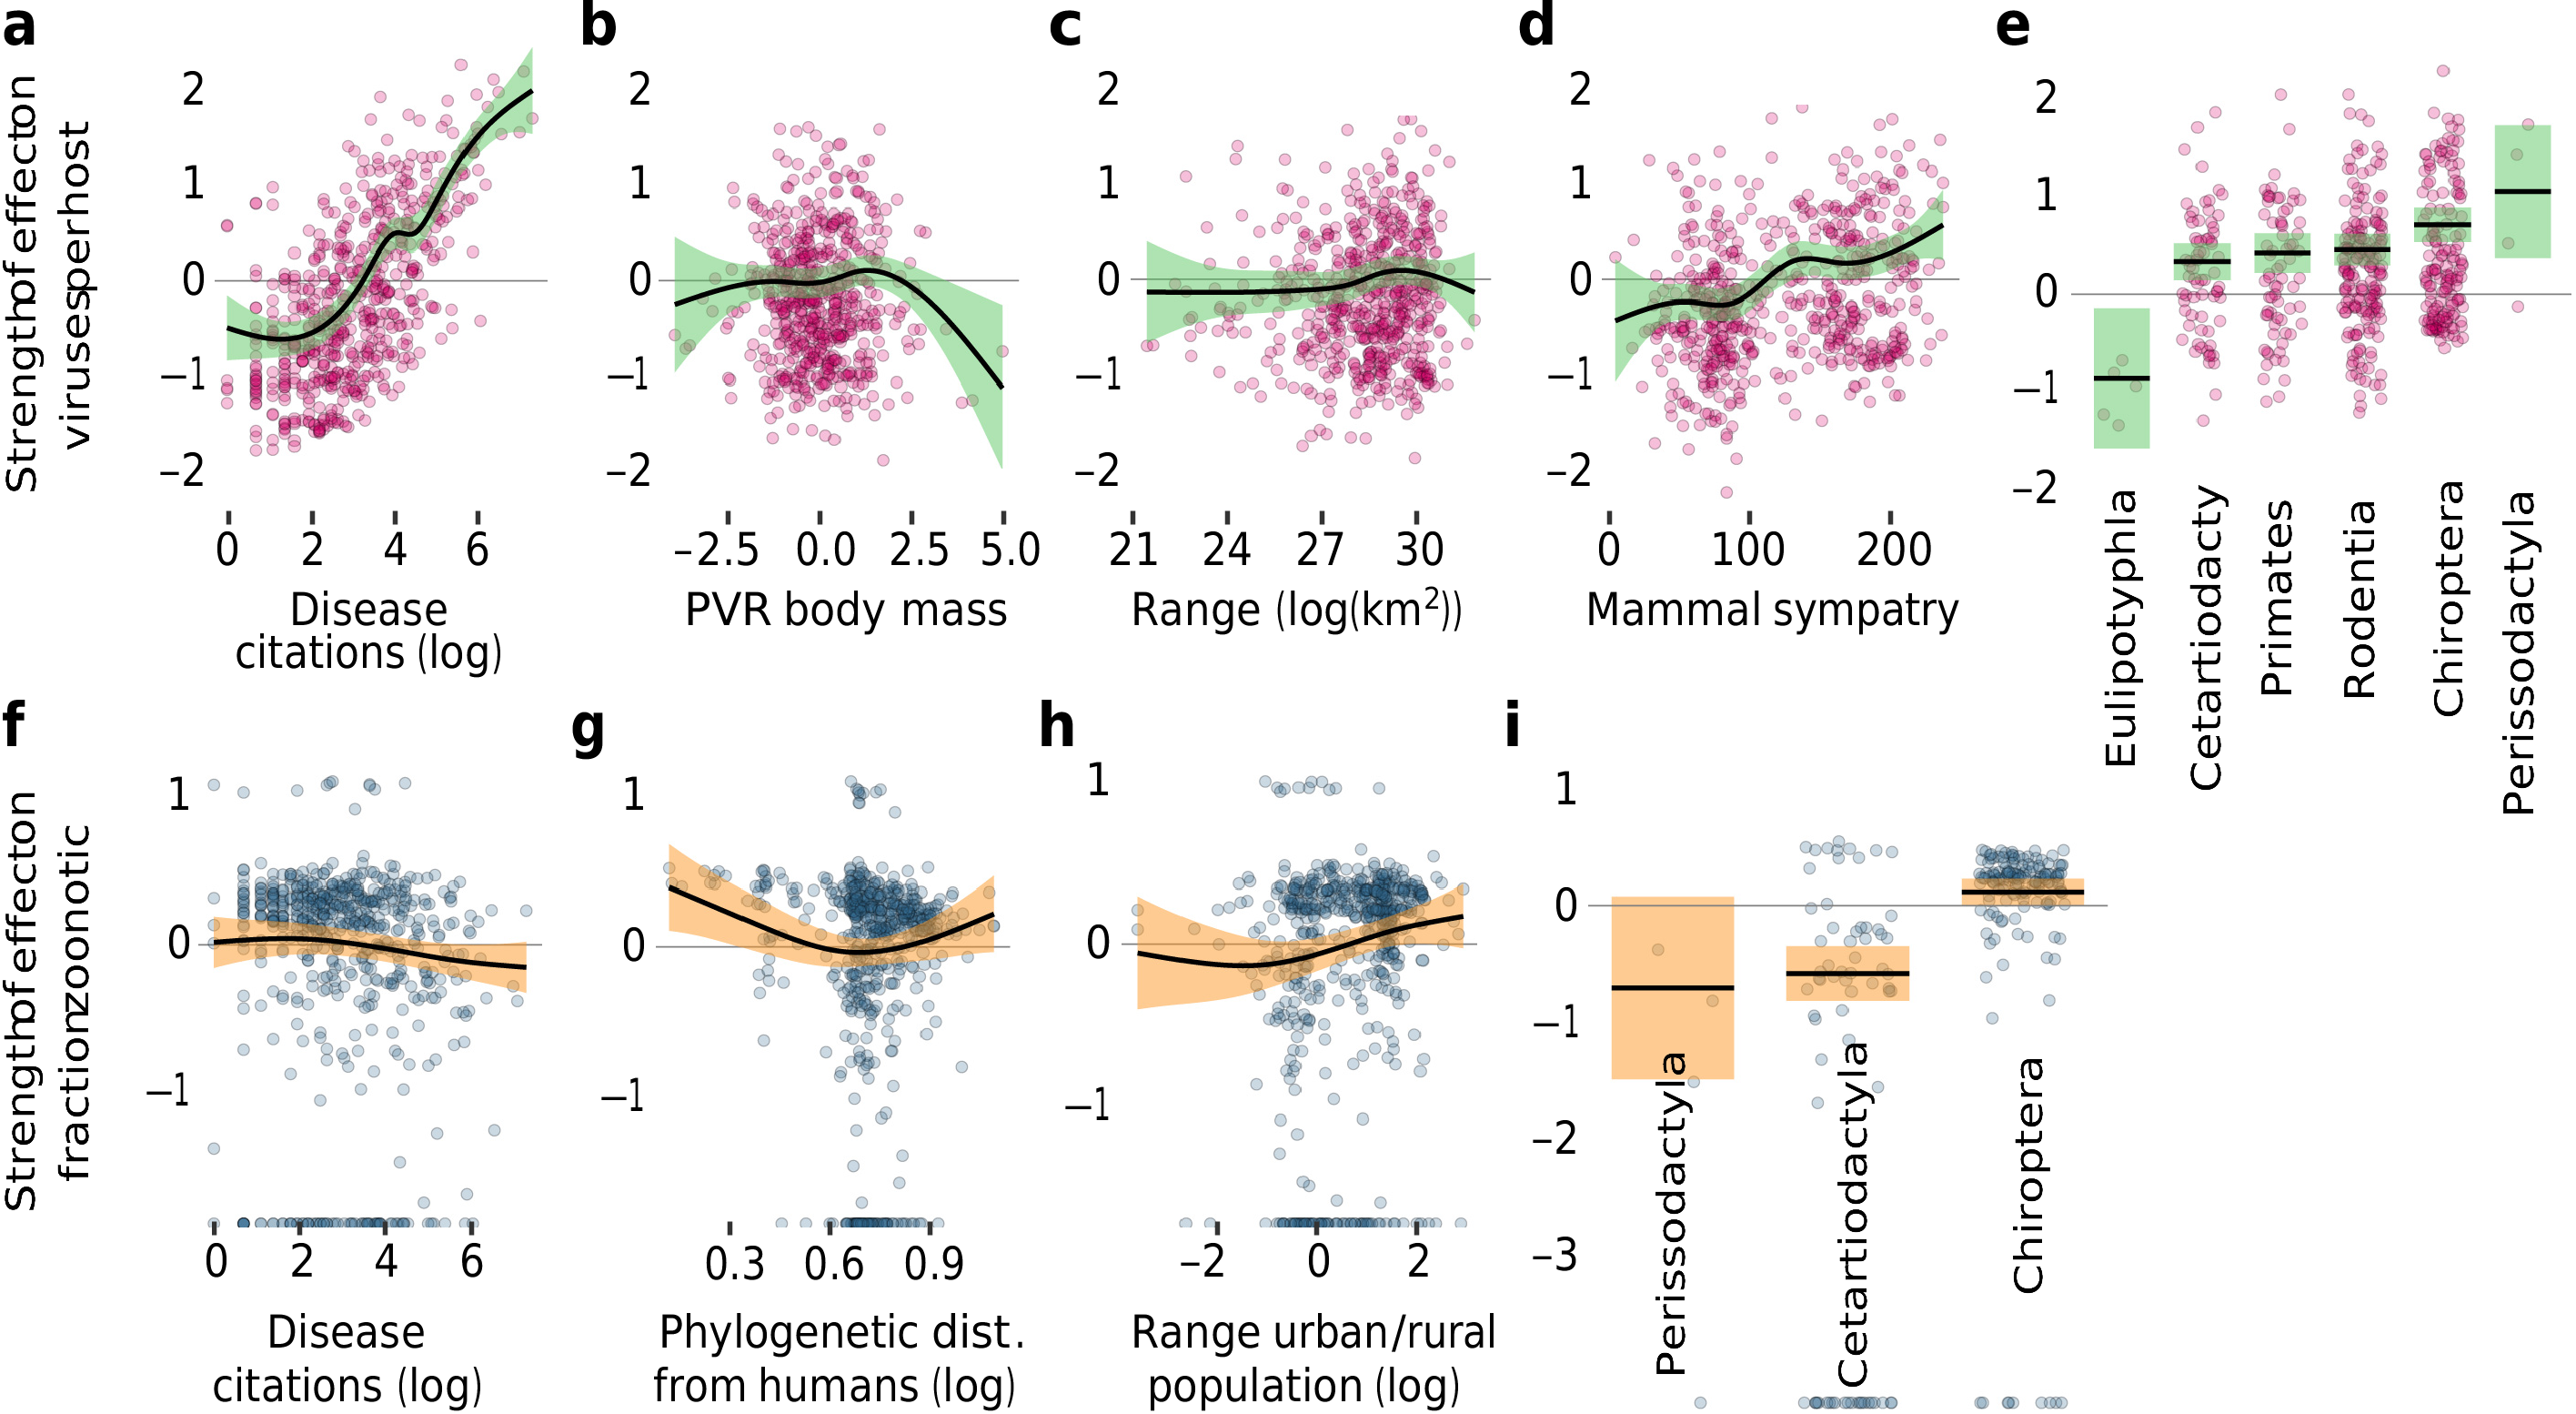
Figure 2 | Host traits that predict total viral richness (top row) and proportion of zoonotic viruses (bottom row) per wild mammal species. Partial effect plots show the relative effect of each variable included in the best-fit GAM, given the effect of the other variables. Shaded circles represent partial residuals; shaded areas, 95% confidence intervals around mean partial effect. a–e, Best model for total viral richness includes: a, number of disease-related citations per host species (research effort, log); b, phylogenetic eigenvector regression (PVR) of body mass (log); c, geographic range area of each species (log km2); d, number of sympatric mammal species overlapping with at least 20% area of target species range; and e, mammalian orders. f–i, Best model for proportion of zoonoses includes: f, research effort (log); g, phylogenetic distance from humans (cytochrome b tree constrained to the topology of the mammal supertree28); h, ratio of urban to rural human population within species range; and i, three mammalian orders. Bats are the only order with a significantly larger proportion of zoonotic viruses than would be predicted by the other variables in the all-data model. Three additional mammalian orders, and whether or not a species is hunted, improved the overall predictive power of the best zoonotic virus model but were non-significant and are not shown (see Extended Data Table 1).
Notes
Files
figure.png
Files
(1.6 MB)
| Name | Size | Download all |
|---|---|---|
|
md5:9c1374a15f63b211f4102e113eee7015
|
1.6 MB | Preview Download |
Linked records
Additional details
Related works
- Is part of
- Journal article: 10.1038/nature22975 (DOI)
- Journal article: urn:lsid:plazi.org:pub:15631C43FFB3FF99FFAE393FFFE8FFE0 (LSID)
- Journal article: https://zenodo.org/record/6467569 (URL)