A deep transcriptome meta-analysis reveals sex-based molecular differences in Multiple Sclerosis (Results and supplementary material)
Creators

- 1. Bioinformatics and Biostatistics Unit, Principe Felipe Research Center (CIPF), 46012, Valencia, Spain
- 2. Foundation Valencian Institute of Oncology (FIVO), 46009, Valencia, Spain
- 3. Bioinformatics and Biostatistics Unit, Principe Felipe Research Center (CIPF), 46012, Valencia, Spain & Faculty of Health Sciences. San Jorge University, 50830, Zaragoza, Spain
- 4. Instituto de Investigación Sanitaria Puerta de Hierro-Segovia de Arana (IDIPHISA), C/Joaquín Rodrigo 2, Majadahonda, 28222 Madrid, Spain
- 5. Biomedical Imaging Unit FISABIO-CIPF, Fundación para el Fomento de la Investigación Sanitaria y Biomédica de la Comunidad Valenciana, 46012, Valencia, Spain
- 6. Department of Pharmacology, Center for Genetic Medicine, Northwestern University Feinberg School of Medicine, Chicago, IL, USA
Description
Results and supplementary material of the manuscript "A deep transcriptome meta-analysis reveals sex-based molecular differences in Multiple Sclerosis".
List of supplementary files:
-
Supplementary Figure 1 (SF01). Principal component analysis plot of study GSE62584. A) The sex of the individuals is indicated in green and orange while the disease status is indicated in rounded and triangular shapes. B) The colors indicate the 4 cell types included in the study, showing the batch effect caused by this factor.
-
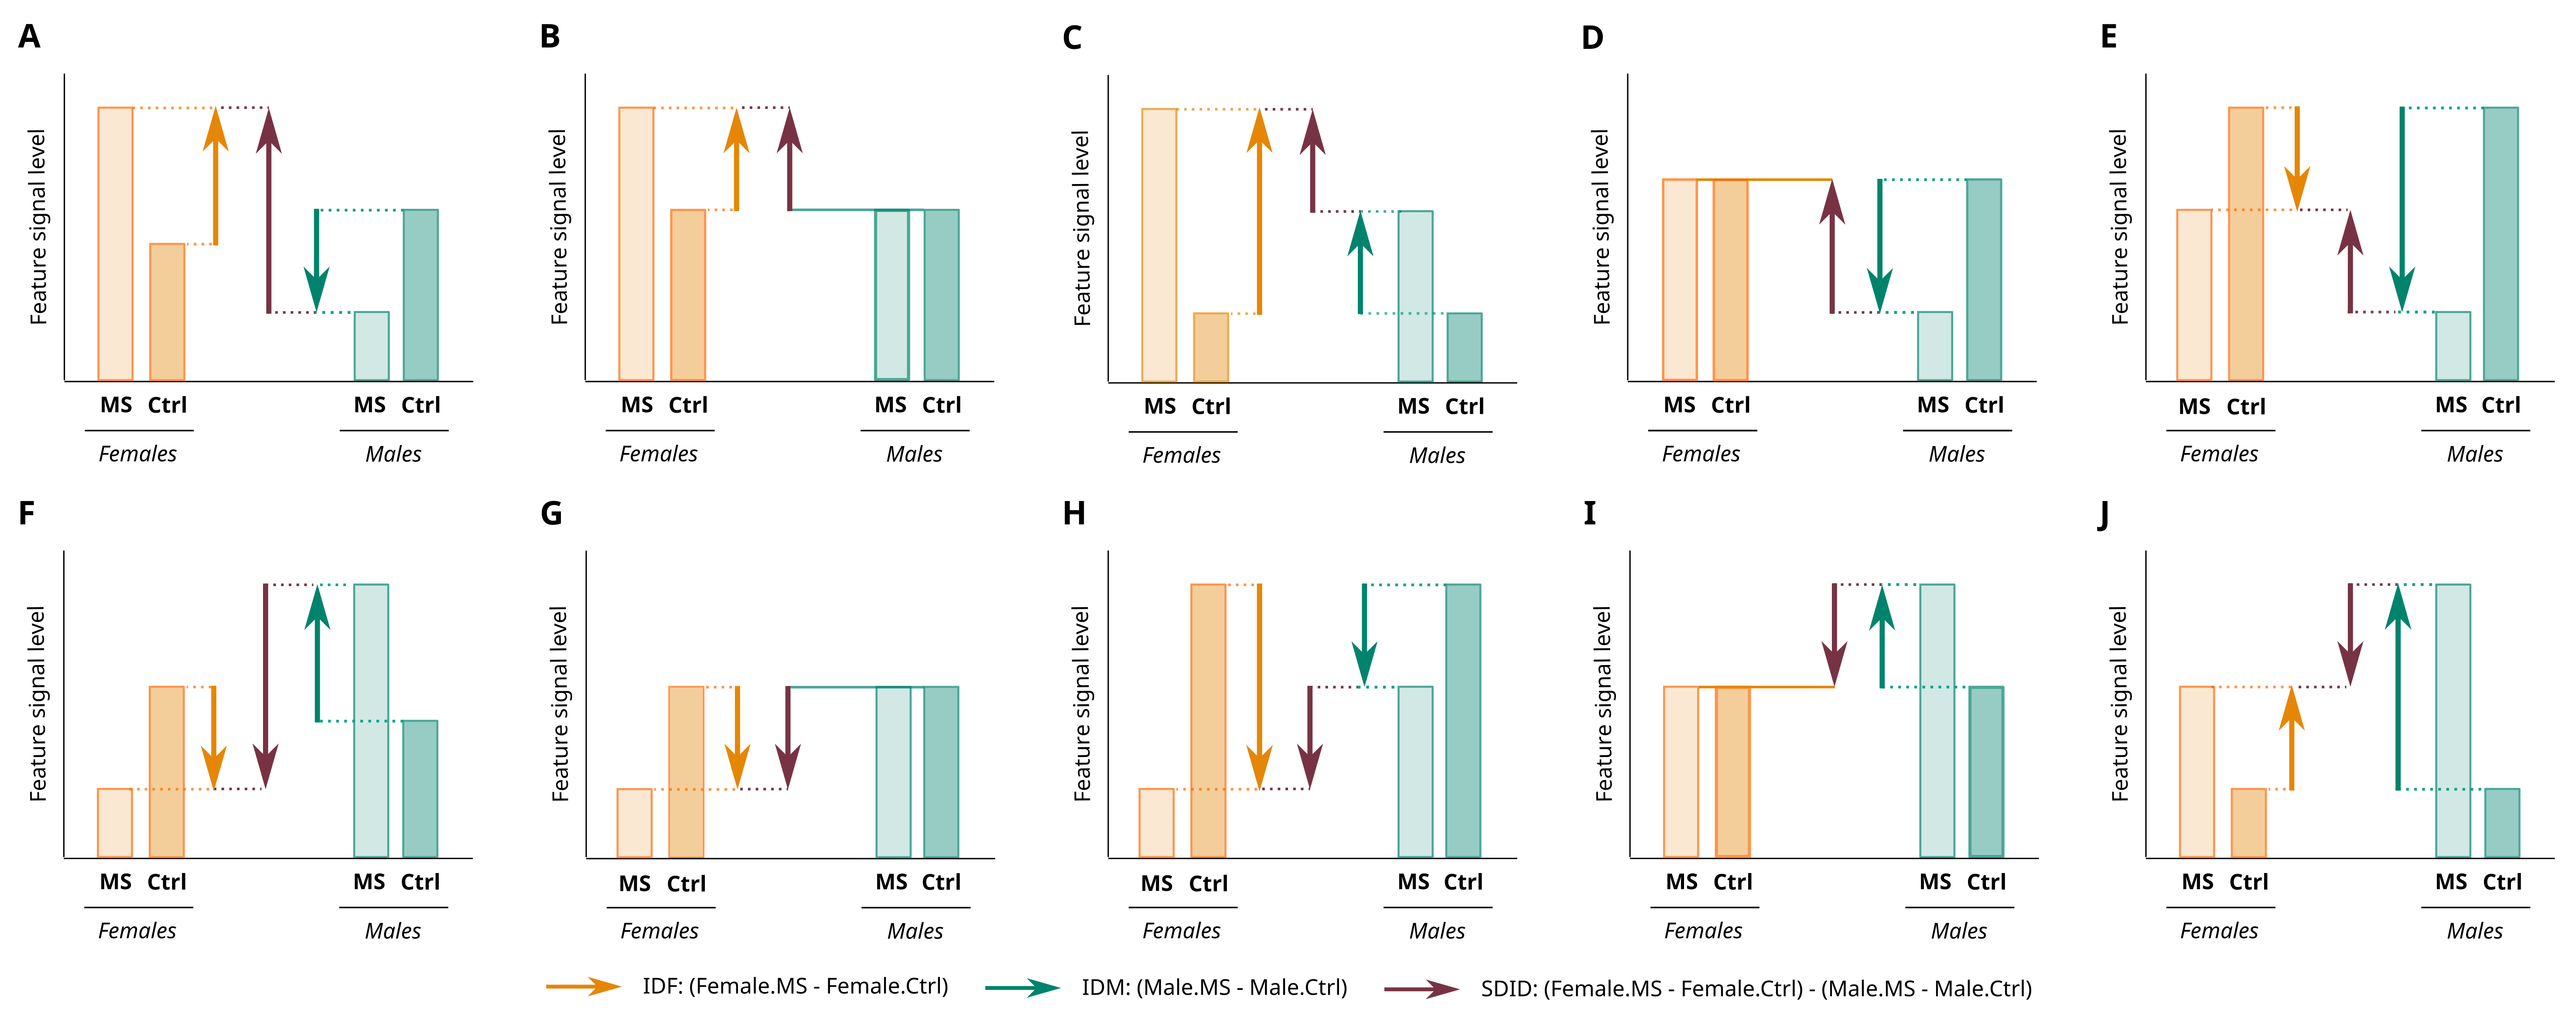
Supplementary Figure 2 (SF02). Bar chart representing the possible causes of a positive (A-E) or negative (F-J) LFC/LOR in the SDID comparison, depending on the results of the IDF or IDM comparisons. The Y-axis represents the level of the feature signal (gene expression in the case of DGE and level of enrichment in functional enrichment). On the X-axis the values for diseased females (light orange), healthy females (dark orange), diseased males (light green) and healthy males (dark green) are shown as vertical bars. The orange arrow represents the magnitude of the IDF comparison (females), the green arrow the magnitude of the IDM comparison (males) and the purple arrow indicates the magnitude of the SDID comparison (IDF vs IDM).
-
Supplementary Table 1. List of R packages and their versions.
-
Supplementary Table 2. Differential gene expression results for IDF (Impact of the Disease in Females) comparison.
-
Supplementary Table 3. Differential gene expression results for IDM (Impact of the Disease in Males) comparison.
-
Supplementary Table 4. Differential gene expression results for SDID (Sex-Differential Impact of the Disease) comparison.
-
Supplementary Table 5. Results of the 6 meta-analyses performed (3 comparisons x 2 tissues).
-
Supplementary Table 6. Results of functional enrichment of nerve tissue using Gene Ontology (GO) biological processes as ontology. The results of each comparison (IDF, IDM, SDID) are separated into tabs.
-
Supplementary Table 7. Results of functional enrichment of nerve tissue using Gene Ontology (GO) biological processes as ontology. Only significant processes are shown, separating in tabs those that are unique to one comparison or are shared by several comparisons.
-
Supplementary Table 8. Results of cellular estimations of the immune system by deconvolution using Cibersort.
-
Supplementary Table 9. Results of functional enrichment of nerve tissue using the Kyoto Encyclopedia of Genes and Genomes (KEGG) pathways as ontology. The results of each comparison (IDF, IDM, SDID) are separated into tabs.
-
Supplementary Table 10. Results of functional enrichment of nerve tissue using the Kyoto Encyclopedia of Genes and Genomes (KEGG) pathways as ontology. Only significant processes are shown, separating in tabs those that are unique to one comparison or are shared by several comparisons.
-
Supplementary Table 11. Table with summarized information on the patients included in the present study (GEO study, GEO accession, disease status and sex).
-
Supplementary Table 12. Raw data available from GEO for individuals included in selected studies.
Additionally, the file "ms-code.tar.gz" contains examples of the code used in each of the steps of the analysis: data loading and normalization (00_Data_loading.Rmd), differential gene expression (01_DGE.Rmd), DGE meta-analysis (02_Meta-analysis_of_DGE.R) and gene set anlysis of the meta-analysis (03_GSA_of_MA.R).
Notes
Files
SF01_PCA_GSE62584.png
Files
(58.7 MB)
| Name | Size | Download all |
|---|---|---|
|
md5:55f2921cfb78cbc0b1556f719ce2d2ee
|
16.7 kB | Download |
|
md5:b4ab94ac9438546df229f9f78bbae7d1
|
277.8 kB | Preview Download |
|
md5:570afe2451cf17116ea30e723951f95d
|
374.6 kB | Preview Download |
|
md5:3153e95e32329f15edabe78b6c885331
|
17.8 kB | Download |
|
md5:9bc337e917e024539623753462ef0169
|
23.6 kB | Download |
|
md5:a9b177f5320f7dfd27681227ed1c77bc
|
161.5 kB | Download |
|
md5:bd9f2c8edd5213b732936d3931916d5c
|
5.5 kB | Download |
|
md5:318e2f6a27c226a86012cff825a5e67f
|
13.0 MB | Download |
|
md5:93f639b7c24fc97689ec4e2368990a35
|
12.9 MB | Download |
|
md5:7a4952c00fd5aeec030eb87c0d23f1cf
|
12.8 MB | Download |
|
md5:f7b905442631f40bee85605591cfaf22
|
17.9 MB | Download |
|
md5:fc1c8a11d7be89a13afbae00a54e7932
|
1.2 MB | Download |
|
md5:8f2d173b02e0e8d4f5d2728b45cddf85
|
58.4 kB | Download |
|
md5:1c176b1b04b92f93dc3a27af797e0403
|
15.1 kB | Download |
|
md5:c75d4b12414da832ea1b882fc1d8c58e
|
57.3 kB | Download |