Published June 30, 2013
| Version v1
Figure
Open
FIG. 9 in The Tapiridae, Rhinocerotidae and Suidae (Mammalia) of the Early Villafranchian site of Milia (Grevena, Macedonia, Greece)
Creators
Description
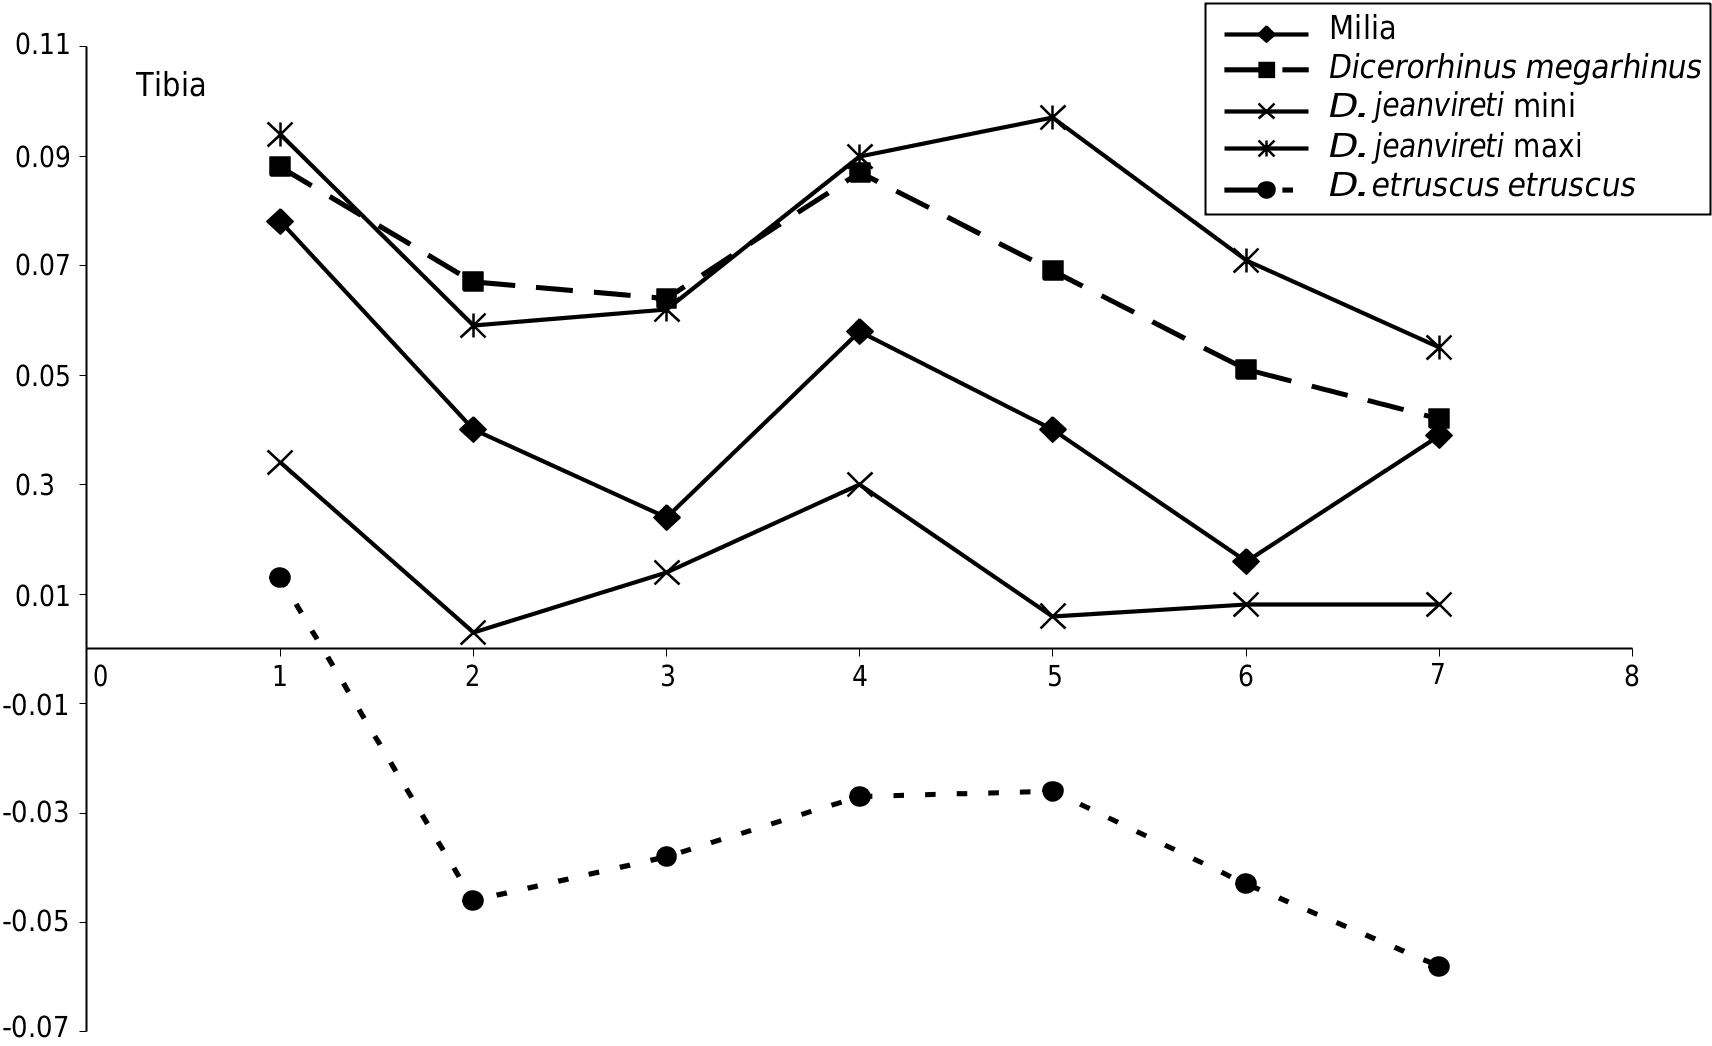
FIG. 9. — Simpson diagram of tibia: values of complete the Milia Dicerorhinus jeanvireti Guérin, 1972 specimen, compared to extreme values of D. jeanvireti and average values of D. megarhinus (de Christol, 1834) and D. etruscus etruscus (Falconer, 1859). The variables on the X axis are the same and in the same order as in Table 7 (see Appendices).
Notes
Files
figure.png
Files
(140.1 kB)
| Name | Size | Download all |
|---|---|---|
|
md5:27f3ef9dffcc6c8dc4e37a63cc5de20b
|
85.5 kB | Preview Download |
|
md5:ce009c40f7130dc347a0c9b261a906ce
|
54.6 kB | Download |
Linked records
Additional details
Related works
- Is cited by
- Taxonomic treatment: http://treatment.plazi.org/id/D11D01485B0A2F74FD54F32BFB06FE5D (URL)
- Is part of
- Journal article: 10.5252/g2013n2a7 (DOI)
- Journal article: urn:lsid:plazi.org:pub:2D2479305B0F2F63FFB7F521FF84FFB2 (LSID)
- Journal article: http://publication.plazi.org/id/2D2479305B0F2F63FFB7F521FF84FFB2 (URL)
- Journal article: https://zenodo.org/record/5374041 (URL)