Fig. 3 in The role of fruit bats in plant community changes in an urban forest in Indonesia
Description
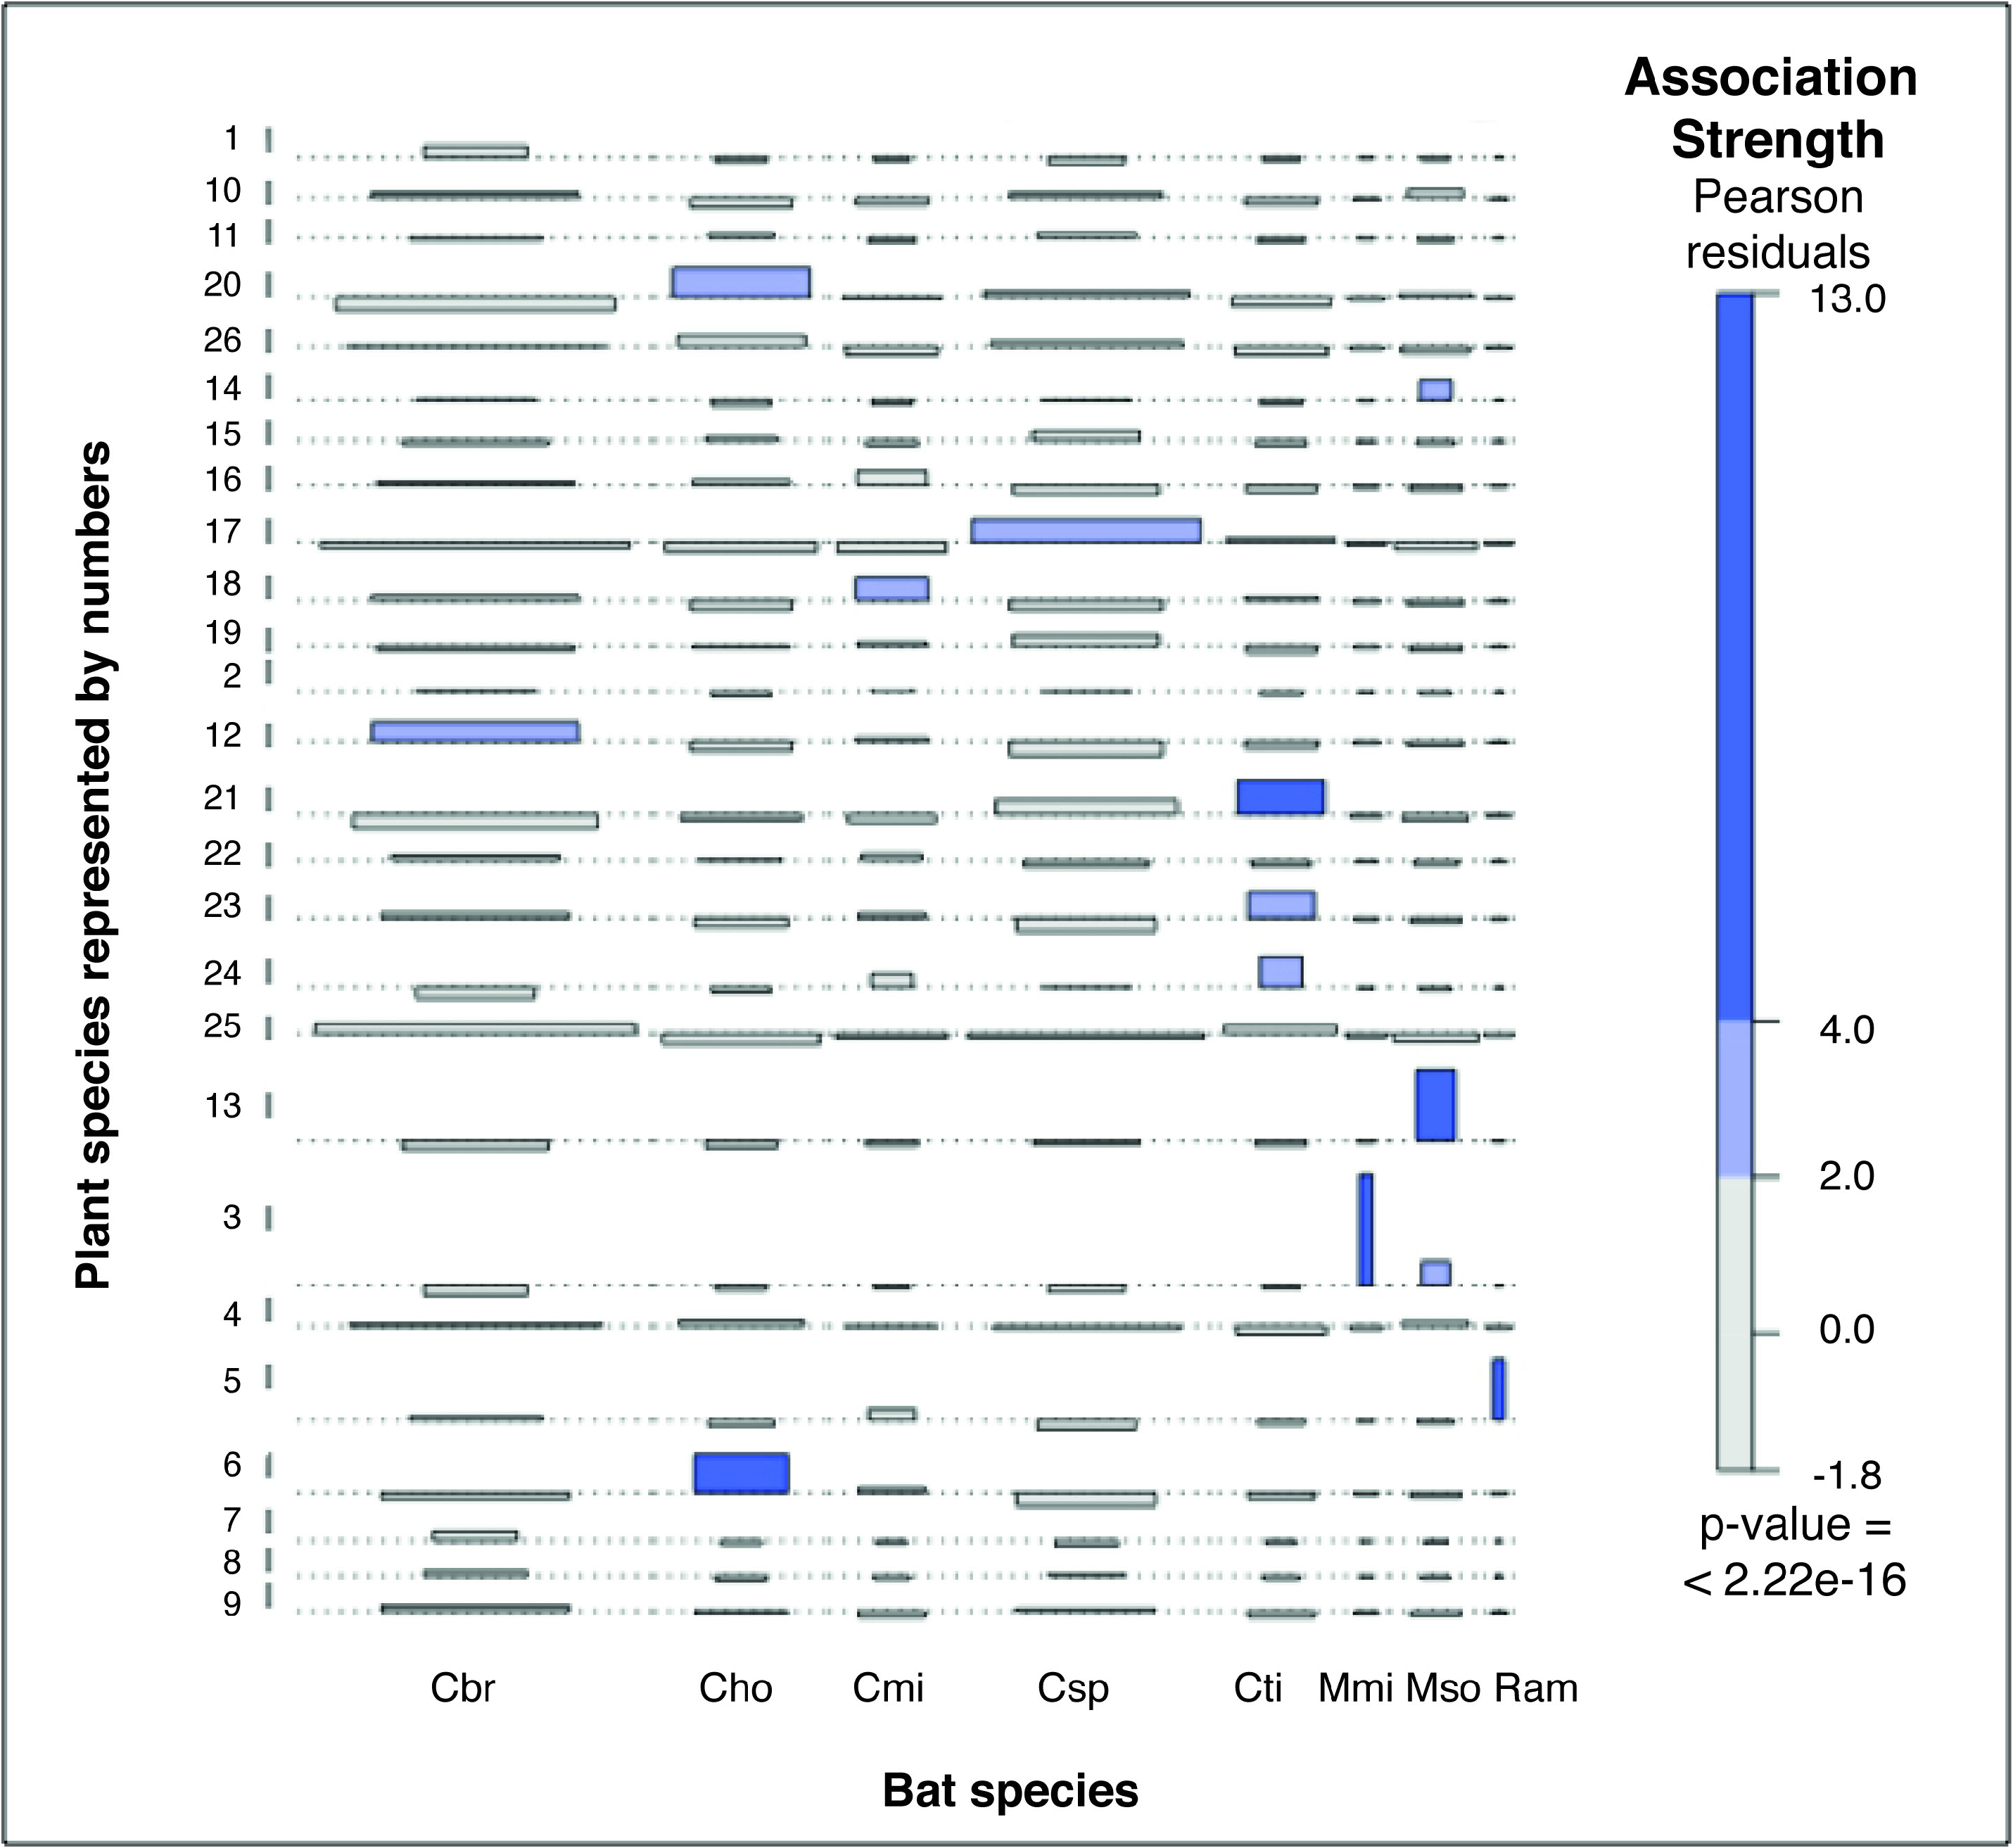
Fig. 3. Association results from vcd between bats and plants. Strength of bat-plant associations are indicated by the height and colour of the bars (Zeileis et al. 2007). The thickness of each bar suggested the number of fruit bats used certain plant species. The length of the bar showed the general diet breath of each fruit bat species. Each of the plant species is represented by a number (1=Filicium decipiens, 2=Nephelium lappaceum, 3=Syzygium sp., 4=Morinda citrifolia, 5=Musa paradisiaca, 6=Pometia pinnata, 7=Cecropia sp., 8=Calliandra sp., 9=Muntingia calabura, 10=Ficus benjamina, 11=Mimusops elengi, 12=Ficus septica, 13=Roystonia regia,14= Acacia mangium,15=Microcos tomentosa, 16=Antidesma sp., 17=Gmelina arborea, 18=Ficus callosa, 19=Syzygium polyanthum, 20=Macaranga sp., 21=Swietenia mahagoni, 22=Ficus hispida, 23= F. racemosa, 24= F. excelsa, 25= F. binnendijkii, 26=Dyospiros sp.). Each of it has a single bar, which depicts the association strength with each of the bat species. The bar graph with darker blue and wider indicates strong association.
Notes
Files
figure.png
Files
(1.7 MB)
| Name | Size | Download all |
|---|---|---|
|
md5:a350949f831be94a615a7c09d40daf19
|
1.7 MB | Preview Download |
Linked records
Additional details
Related works
- Is part of
- Journal article: 10.5281/zenodo.5357750 (DOI)
- Journal article: urn:lsid:plazi.org:pub:2B02FFDD15398523DC7C6F63FF9E2206 (LSID)