Chamoli Disaster Post-event 2-m DEM Composite (February 10-11, 2021) and Difference Map
Creators

- 1. University of Washington
- 2. CNRS, LEGOS, University of Toulouse
- 3. CESBIO, University of Toulouse
- 4. CNRS, CESBIO
Description
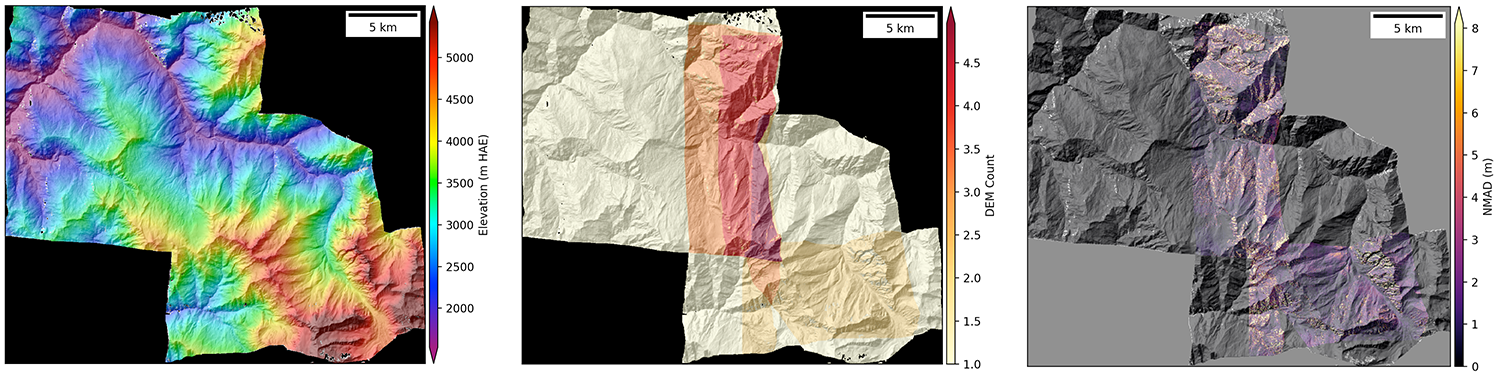
This “fine-quality” 2-m DEM composite was created using a combination of 5 cross-track stereo DEMs generated from 5 overlapping monoscopic Maxar/DigitalGlobe WorldView-2, WorldView-3 and GeoEye-1 images acquired on February 10, 2021 and February 11, 2021, and one DEM generated from 2 Pléiades-HR1B in-track stereo images acquired on February 10, 2021. This composite provides the first continuous DEM of primary areas affected by the February 7, 2021 event.
The 5 cross-track stereo DEMs were processed by the UW team using the NASA Ames Stereo Pipeline v2.6.2_post (Beyer et. al, 2018; build d7eb7c8) and a modified version of the methodology presented in Shean et al. (2016; 2020). Input images were orthorectified at native GSD using the 30-m Copernicus DEM (converted to ellipsoidal heights). See http://doi.org/10.5281/zenodo.4533679 for additional details on processing. Each output DEM (height above the WGS84 ellipsoid) was posted at 2.0 m with UTM 44N projection (EPSG:32644).
The Pléiades stereo DEM (Chamoli_2021-02-10_SGM/Chamoli_2021-02-10_DEM_4m.tif) was processed by the CNRS team using the NASA Ames Stereo Pipeline with SGM correlation algorithm. The output DEM (height above the WGS84 ellipsoid) was posted at 4.0 m with UTM 44N projection (EPSG:32644). For additional details on processing of the Pléiades DEM, see Deschamps-Berger et al. (2020).
Each DEM was co-registered to a filtered/masked version of the September 2015 Chamoli Disaster Pre-event 2-m DEM Composite (http://doi.org/10.5281/zenodo.4554647) using the demcoreg/dem_align.py utility (http://doi.org/10.5281/zenodo.3243481) with RGI glacier polygons and snow (Panchromatic top-of-atmosphere reflectance threshold of 0.4) masked. One cross-track DEM (WV02WV02_20210211_10300100B5B53500_10300100B5AB8400) with poor stereo geometry (convergence angle of 7.6°) required an additional planar correction, which was fit to masked/filtered DEM difference values. The Pléiades DEM required additional correction to remove along-track “jitter” artifacts. This was accomplished by computing median value for each row of the masked/filtered DEM difference map, smoothing the resulting 1D curve with a Savitzky–Golay filter (window length of 101 px, polynomial order 2), and removing from the full Pleiades DEM.
A per-pixel weighted mean DEM composite (*wmean.tif) was produced from the co-registered, filtered DEMs using the ASP dem_mosaic utility (https://stereopipeline.readthedocs.io/en/latest/tools/dem_mosaic.html). This approach uses a weighting scheme that favors spatially continuous coverage (as opposed to small clusters separated by nodata values). Due to the limited set of overlapping DEMs, several areas of the composite include values from a single input DEM.
Additional composites were created for the per-pixel DEM count (*count.tif) and per-pixel normalized median absolute deviation (NMAD, *nmad.tif). The latter captures the spread of elevation values in the input DEMs and offers a metric of relative accuracy. A shaded relief map (*hs.tif) is included for visualization of the DEM composite. All files are tiled, LZW-compressed GeoTiff format with internal overviews (GDAL gauss resampling).
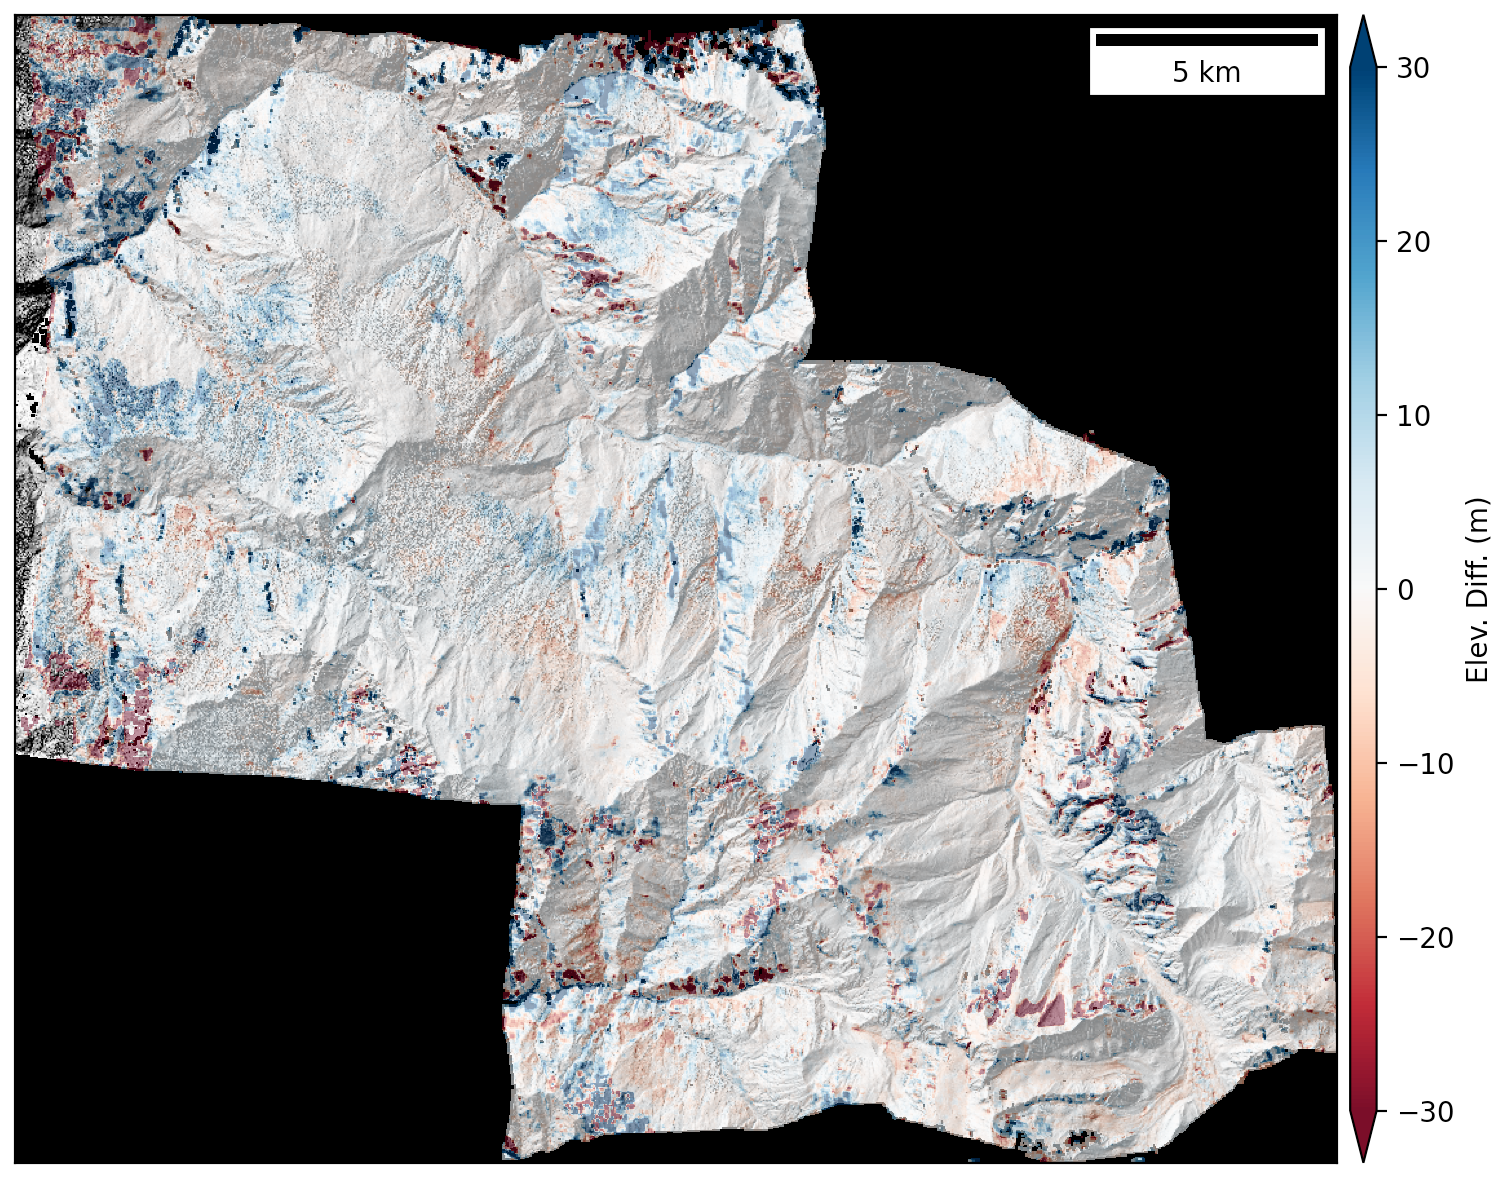
A DEM difference map (*diff.tif) was produced using the September 2015 weighted-mean DEM composite (http://doi.org/10.5281/zenodo.4554647) and this February 10-11, 2021 weighted-mean DEM composite. This difference map shows elevation change between these two time periods, including many large changes associated with the February 7, 2021 event. No additional filtering, masking or quality control has been performed on this difference map. We urge users to exercise caution when interpreting signals in the DEM difference map, as many errors and artifacts remain.
The cross-track stereo pairs were formed from independently acquired monoscopic images, often by different sensors on different orbits, hours to days apart. The snowcover and illumination conditions between these images was variable, and the acquisition geometry was not optimized for stereo. Shadows, occlusions and failed correlation resulted in nodata gaps and residual artifacts in each of the cross-track stereo DEMs. Some of these problematic areas can be identified by their low per-pixel count and high per-pixel NMAD values, and we recommend that users mask or avoid analysis in these areas. Artifacts and higher NMAD values are also observed over forests, steep slopes and open water (including the river systems affected by the February 7, 2021 event). Residual “cross-hatch” artifacts from the SGM correlator are observed in some areas of the Pléiades DEM.
We performed a preliminary evaluation of the post-event DEM composite for areas within ~1-2 km of the river systems affected by the February 7, 2021 event. We observed large signals associated with geomorphic change, but also large residual artifacts in places, and we recommend that users exercise caution when performing quantitative analysis and detailed geomorphologic interpretation.
If possible, the corresponding WorldView-2, WorldView-3, and GeoEye-1 orthoimages should be used during interpretation of the DEM products to distinguish artifacts from real features. These orthoimages cannot be distributed due to licensing restrictions, but they are available via the NGA NextView License for U.S. federal research and can be purchased from Maxar/DigitalGlobe, Inc. Several of these images are publicly available through Maxar's Open Data program (https://www.maxar.com/open-data/uttarakhand-flooding).
The original Level-1B WorldView-2/3 and GeoEye-1 images (© 2021 Maxar/DigitalGlobe, Inc.) are available under the NGA NextView license. The Pléiades images (Pléiades © CNES 2021 and AIRBUS DS) were licensed to CNES. Portions of the per-pixel weighted-mean composite in this repository include values from the corrected version of the Pléiades DEM (a derivative product subject to the CC-BY-NC 4.0 license preventing commercial use, https://creativecommons.org/licenses/by-nc/4.0/legalcode). By downloading these products, you agree to comply with these licensing restrictions.
If you use these data products for any purposes, please use the recommended attribution/citation for this Zenodo repository (https://doi.org/10.5281/zenodo.4558692) and cite the following papers:
-
Shugar, D. H., M. Jacquemart, D. Shean, S. Bhushan, K. Upadhyay, A. Sattar, W. Schwanghart, S. McBride, M. V. W. de Vries, M. Mergili, A. Emmer, C. Deschamps-Berger, M. McDonnell, R. Bhambri, S. Allen, E. Berthier, J. L. Carrivick, J. J. Clague, M. Dokukin, S. A. Dunning, H. Frey, S. Gascoin, U. K. Haritashya, C. Huggel, A. Kääb, J. S. Kargel, J. L. Kavanaugh, P. Lacroix, D. Petley, S. Rupper, M. F. Azam, S. J. Cook, A. P. Dimri, M. Eriksson, D. Farinotti, J. Fiddes, K. R. Gnyawali, S. Harrison, M. Jha, M. Koppes, A. Kumar, S. Leinss, U. Majeed, S. Mal, A. Muhuri, J. Noetzli, F. Paul, I. Rashid, K. Sain, J. Steiner, F. Ugalde, C. S. Watson, and M. J. Westoby (2021), A massive rock and ice avalanche caused the 2021 disaster at Chamoli, Indian Himalaya, Science, 373(6552), 300–306, doi:10.1126/science.abh4455.
-
Shean, D. E., Bhushan, S., Montesano, P., Rounce, D. R., Arendt, A., & Osmanoglu, B. (2020). A Systematic, Regional Assessment of High Mountain Asia Glacier Mass Balance. Frontiers in Earth Science, 7. https://doi.org/10.3389/feart.2019.00363.
-
Shean, D. E., Alexandrov, O., Moratto, Z. M., Smith, B. E., Joughin, I. R., Porter, C., & Morin, P. (2016). An automated, open-source pipeline for mass production of digital elevation models (DEMs) from very-high-resolution commercial stereo satellite imagery. ISPRS Journal of Photogrammetry and Remote Sensing, 116, 101–117. https://doi.org/10.1016/j.isprsjprs.2016.03.012.
-
Deschamps-Berger, C., Gascoin, S., Berthier, E., Deems, J., Gutmann, E., Dehecq, A., Shean, D., and Dumont, M. (2020). Snow depth mapping from stereo satellite imagery in mountainous terrain: evaluation using airborne laser-scanning data. The Cryosphere, 14(9), 2925–2940. https://doi.org/10.5194/tc-14-2925-2020
Support for the UW team provided by NASA High-Mountain Asia Team (HiMAT) and NASA Future Investigators in NASA Earth and Space Science and Technology (FINESST) programs. Resources supporting this work were provided by the NASA High-End Computing (HEC) Program through the NASA Advanced Supercomputing (NAS) Division at Ames Research Center.
Input monoscopic Maxar/DigitalGlobe WorldView-2, WorldView-3 and GeoEye-1 images (See https://discover.digitalglobe.com/bc9a401c-7675-11eb-8dc9-d2d1504a7e93):
- Image ID, Date (YYYYMMDD)
- 10300100B5B53500, 20210211
- 10300100B5AB8400, 20210211
- 10400100656B6900, 20210210
- 1050010022685000, 20210210
- 1050010022685100, 20210210
Corresponding Cross-track Stereo Pairs:
- WV02WV02_20210211_10300100B5B53500_10300100B5AB8400
- GE01WV03_20210210_1050010022685100_10400100656B6900
- GE01WV03_20210210_1050010022685000_10400100656B6900
- GE01WV02_20210210_1050010022685100_10300100B5B53500
- WV03WV02_20210210_10400100656B6900_10300100B5B53500
Pleiades HR1B Stereo Pair:
- DS_PHR1B_202102100526278_FR1_PX_E079N30_0911_01654
- DS_PHR1B_202102100526378_FR1_PX_E079N30_0911_01693
Files
00_Chamoli_Feb2021_Composite_DEM2m_3panel_preview.png
Files
(1.2 GB)
| Name | Size | Download all |
|---|---|---|
|
md5:d8dab89f3a8eb837660cf85707ce1ca0
|
755.8 kB | Preview Download |
|
md5:740c87da3ca7e05c59c13d76c2008587
|
2.6 MB | Preview Download |
|
md5:9b7a5648b37410dd8bd1e591e3bc5702
|
17.5 MB | Preview Download |
|
md5:ee9383d81b0d2bb8399fa614bb79bcbe
|
212.8 MB | Preview Download |
|
md5:4317b80fe9110faa89593cd5651136c6
|
313.6 MB | Preview Download |
|
md5:2f501c88110c3c34f931d79725a3ff25
|
182.2 MB | Preview Download |
|
md5:8662195b5a94a2fd259e58f613a6c55e
|
512.9 MB | Preview Download |