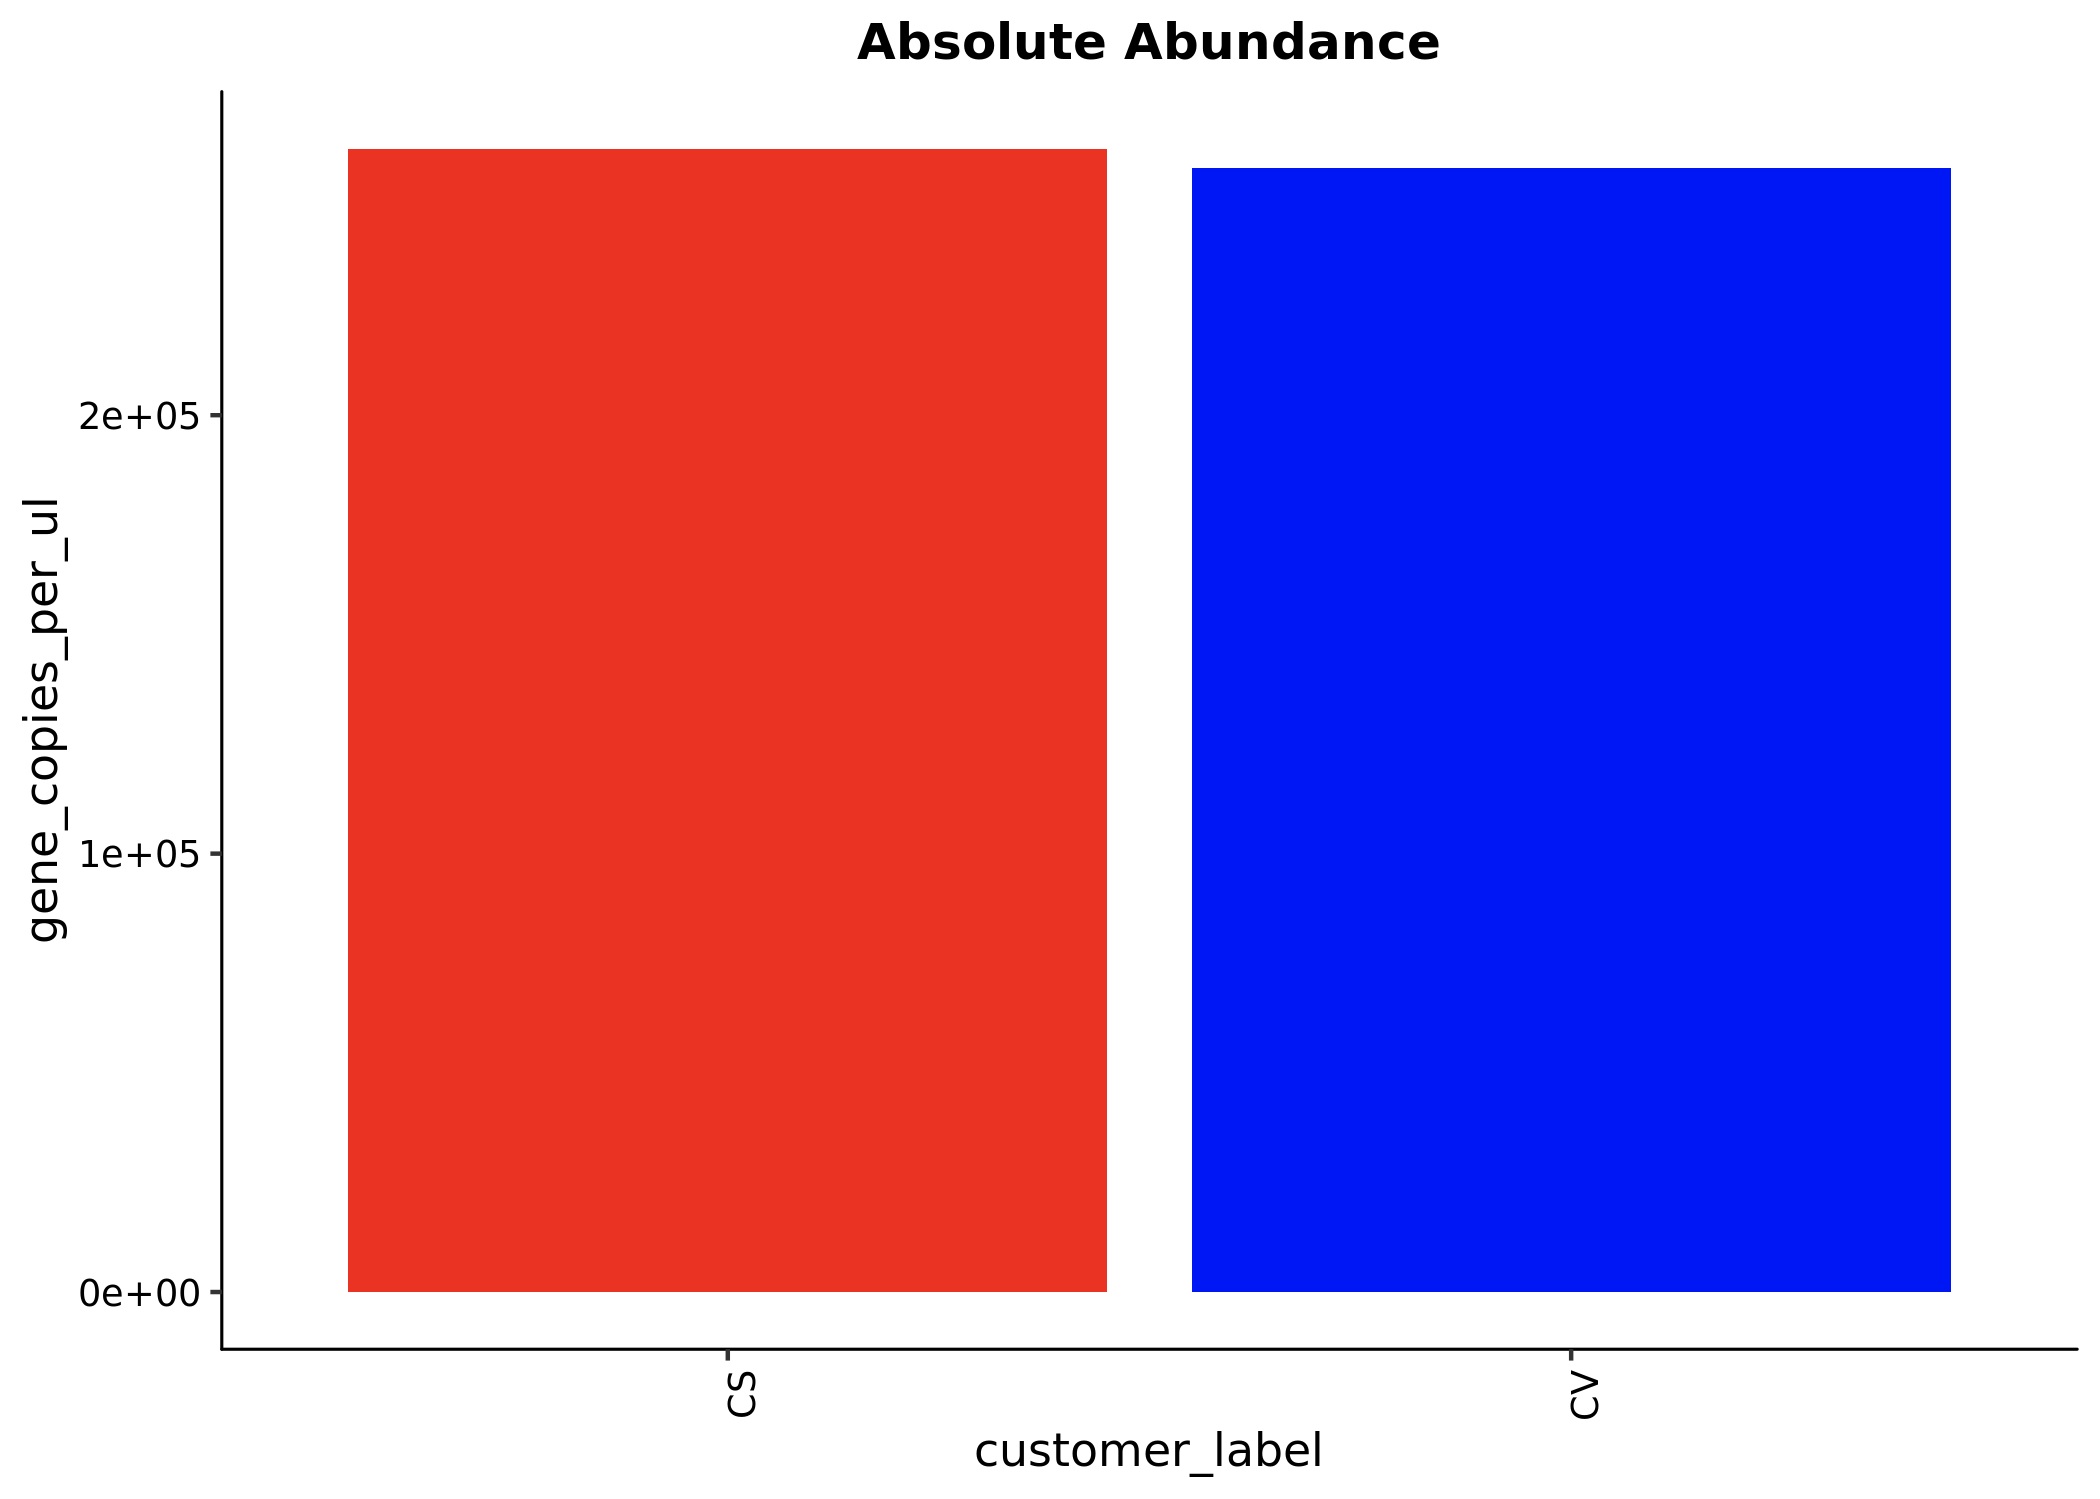
Fig. S1. Absolute Abundance. The plot below shows the absolute abundance of bacterial (16S) DNA measured in the samples. For analyses without group comparison, a histogram of gene copies per microliter in each sample is shown.
Fig. S2. Barplot by Species. Taxa composition plots illustrate the bacterial composition.
Fig. S3. Barplot by Genus. Taxa composition plots illustrate the bacterial composition.
Fig. S4. Barplot by Family. Taxa composition plots illustrate the bacterial composition.
Fig. S5. Barplot by Order. Taxa composition plots illustrate the bacterial composition.
Fig. S6. Barplot by Class. Taxa composition plots illustrate the bacterial composition.
Fig. S7. Barplot by Phylum. Taxa composition plots illustrate the bacterial composition.
Fig. S8. Taxonomy Heatmaps by Species. The taxonomy abundance heatmap with sample clustering by Species.
Fig. S9. Taxonomy Heatmaps by Genus. The taxonomy abundance heatmap with sample clustering by Genus.
Fig. S10. Taxonomy Heatmaps by Family. The taxonomy abundance heatmap with sample clustering by Family.
Fig. S11. Taxonomy Heatmaps by Order. The taxonomy abundance heatmap with sample clustering by Order.
Fig. S12. Taxonomy Heatmaps by Class. The taxonomy abundance heatmap with sample clustering by Class.
Fig. S 13. Taxonomy Heatmaps by Phylum. The taxonomy abundance heatmap with sample clustering by Phylum.
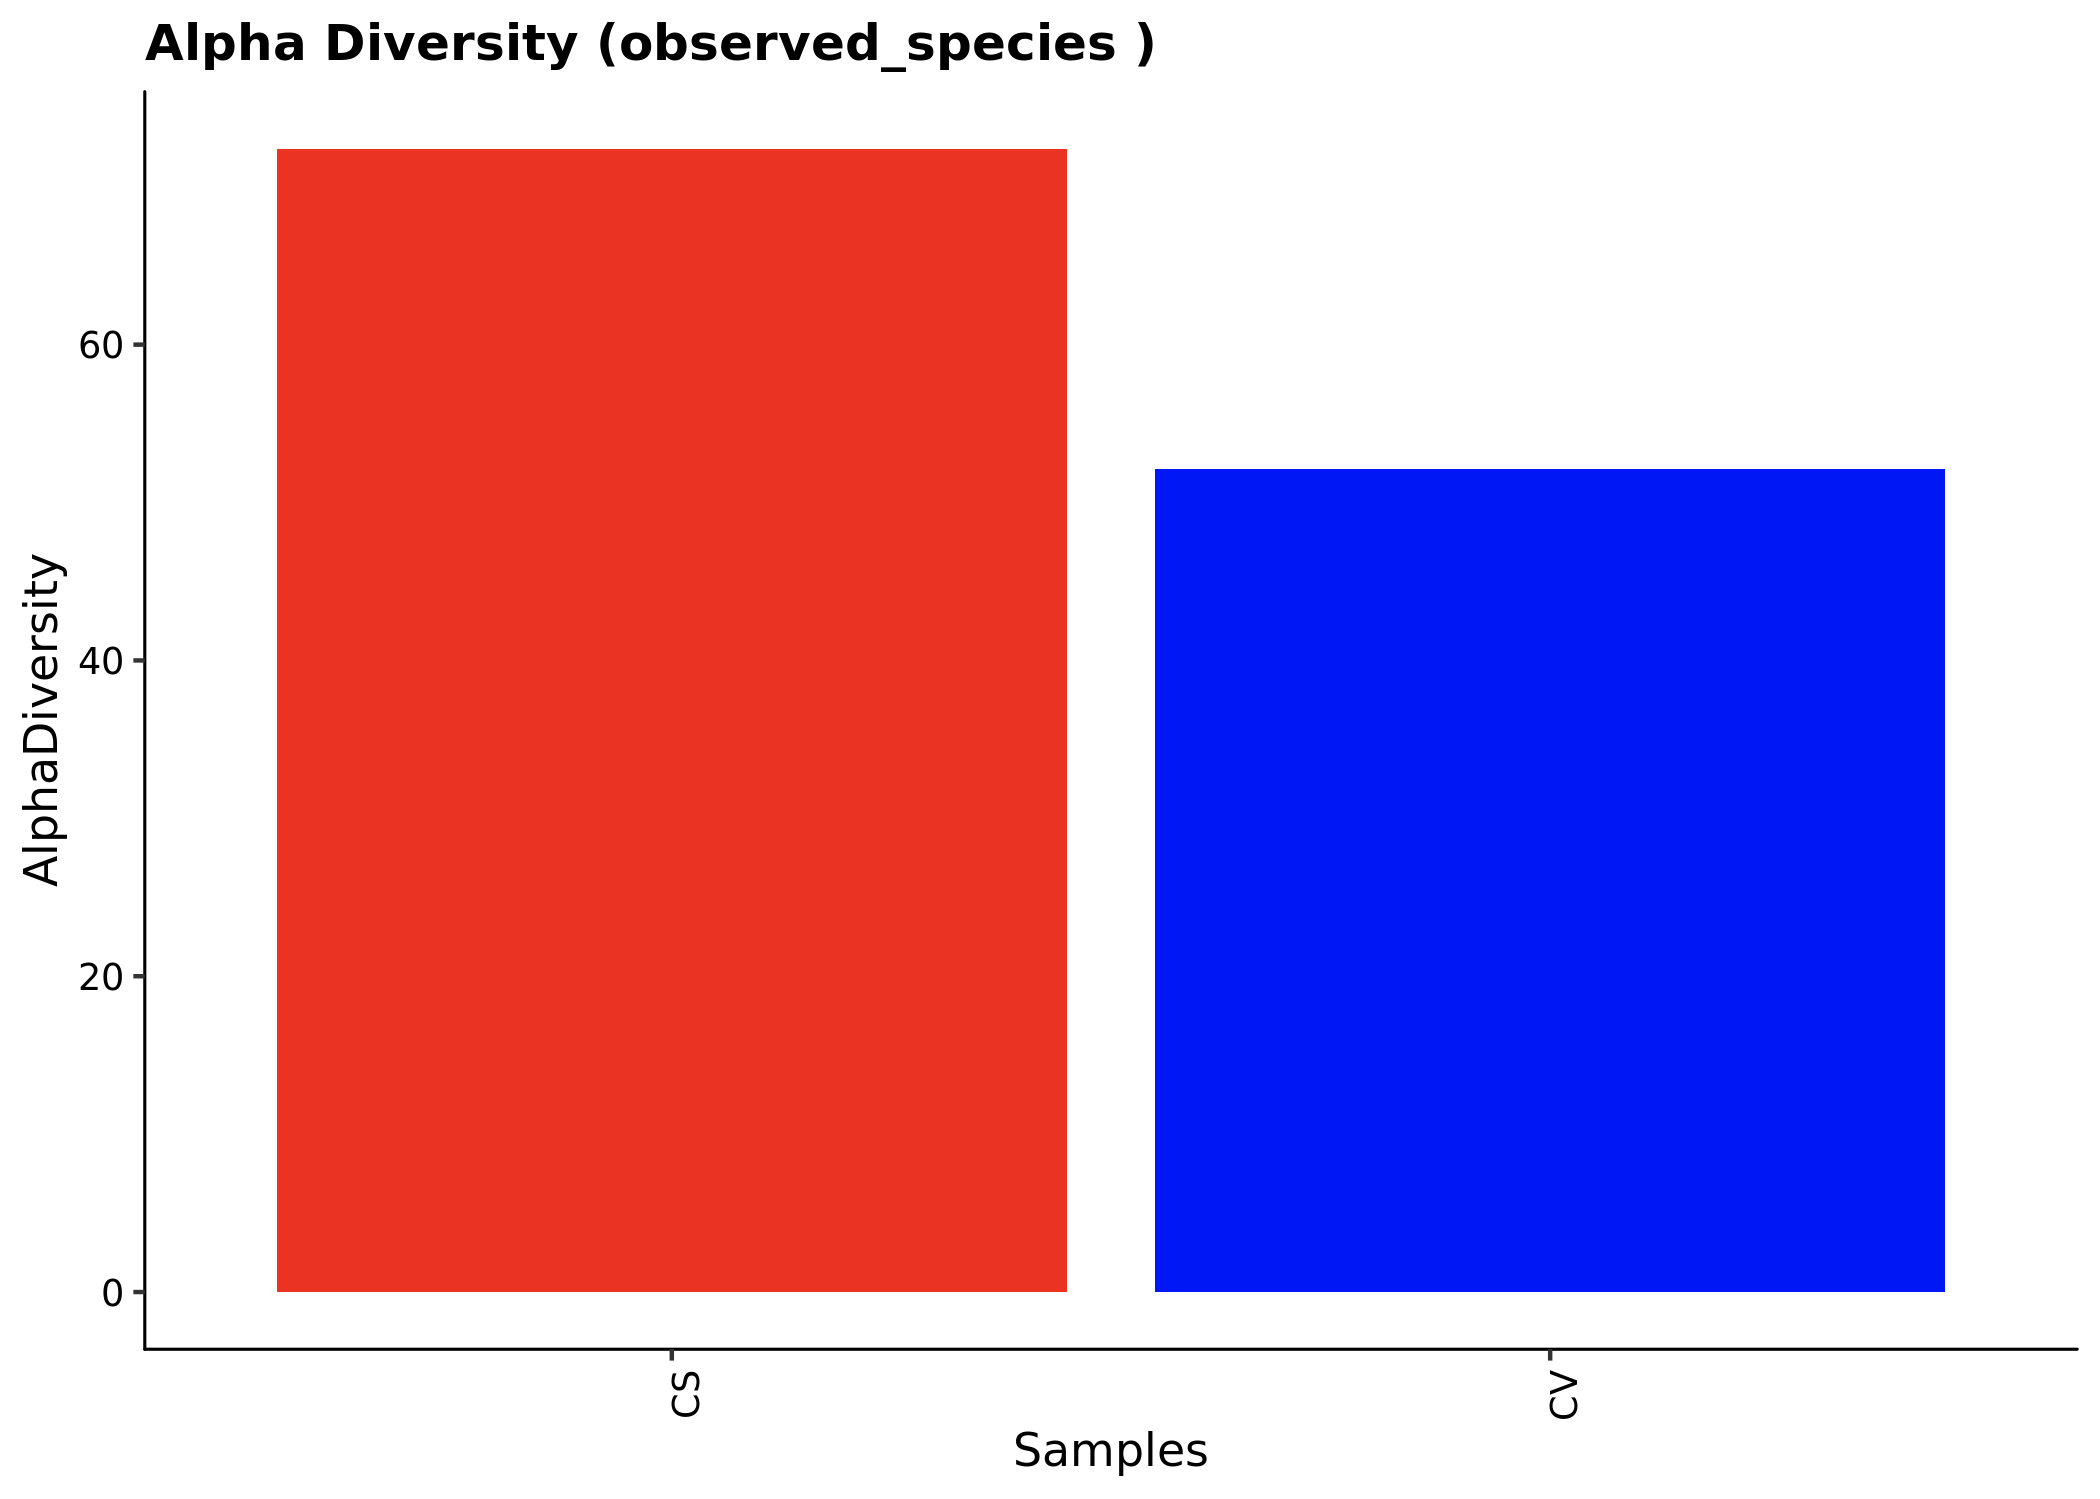
Fig. S14. Alpha Diversity. This figure illustrates the alpha diversity of microbial communities in the samples, measured by the number of observed species. The histogram represents observed species counts for each sample without group comparisons.
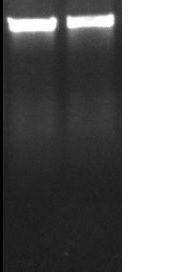
Fig. S15. Agarose electrophoresis. The agarose electrophoresis from Bacterial DNA extracted follower the ZymoBIOMICS kit instruction for Next Generation Sequencing.
Index header sup tables
Table S1. Description of the bacteria distribution by phylum. Reported 6 different bacterial phylums for both scorpions.
Table S2. Description of the bacteria distribution by class. Reported 10 different bacterial classes for both scorpions.
Table S3. Description of the bacteria distribution by order. Reported 18 different bacterial orders for both scorpions.
Table S4. Description of the bacteria distribution by family. Reported 24 different bacterial families for both scorpions.
Table S5. Description of the bacteria distribution by genus. Reported 35 different bacterial genus for both scorpions
Table S6. Description of the bacteria distribution by species. Reported 69 different bacterial species for both scorpions
Table S7. Biochemical bact desc. scorpions. Biochemical characteristics of the bacteria found.
Table S8. Mass of amino acids. The mass of amino acids.
Table S9. Percentage of amino acids. The percentage of amino acids.
Table S10. Average amino acids. The average of amino acids.
Table S11. Estat_AA. Data from static analyses performed for the amino acids are provided in Table 11 of the supplementary material. We include the p-values in the columns labeled "p adj" and we provide the difference in means between group comparisons under the column "diff". To aid in assessing the statistical significance and reliability of these differences, the lower and upper confidence limits are presented in the "lwr" and "upr" columns respectively. These enhancements ensure a comprehensive overview of the post-hoc comparisons conducted following our ANOVA analysis.
Table S12. Mass of AcylCarnitines. The mass of acyl carnitines.
Table S13. Percentage of AcylCarnitines. The percentage of acyl carnitines.
Table S14. Average AcylCarnitines. The average of acyl carnitines.
Table S15. Estat_AcC. Data from static analyses performed for the acyl carnitines are provided in Table 15 of the supplementary material. We include the p-values in the columns labeled "p adj" and we provide the difference in means between group comparisons under the column "diff". To aid in assessing the statistical significance and reliability of these differences, the lower and upper confidence limits are presented in the "lwr" and "upr" columns respectively. These enhancements ensure a comprehensive overview of the post-hoc comparisons conducted following our ANOVA analysis.
Table S16. Read Processing Summary. Summary of the 16S rRNA sequencing data processing. It includes raw read counts, quality-trimmed sequences, DADA2-inferred reads, chimera removal, and the number of unique sequences retained after all filtering steps for C. suffusus and C. vittatus.
Table S17. Pairwise Sequence Similarity (%) Between Identified Bacterial Taxa. Matrix showing percent identity values between 16S rRNA sequences assigned to bacterial taxa identified in C. suffusus and C. vittatus. Values were calculated to evaluate confidence in species-level assignments. Diagonal values represent 100% similarity (self-comparison).
Abstract
The scorpions, characterized by venomous stingers, possess a diverse array of chemicals in their venom, with medically significant species belonging to families like Buthidae. In Mexico, Centruroides suffusus and Centruroides vittatus coexist, with C. suffusus considered medically important due to its highly toxic venom. This study compares their physiology, focusing on microbiome and metabolome analysis. The metabolomic profiling (12 amino acids and 28 acylcarnitines) reveals significant differences between the two species, hinting at metabolic and ecological variations. Ornithine (ORN) and arginine (ARG) were the most abundant in C. vittatus, while tyrosine (TYR) was the most abundant amino acid molecule in C. suffusus. The microbiome analysis (by Next-Generation Sequencing of the 16S ribosomal gene) indicates similarities in gut bacteria composition between the two species (Phyla: Actinobacteria, Bacteroidetes, Cyanobacteria, Firmicutes, Proteobacteria and Tenericutes).

 Universidad Autónoma de Nuevo León