Propensity Score Matching (PSM) Python-based code
Authors/Creators

-
1.
 University of Cantabria
-
2.
 Servicio Cántabro de Salud
- 3. Instituto de Investigación Marqués de Valdecilla (IDIVAL)
Description
OVERVIEW / FINAL SUMMARY
This repository provides 4 variants of a free, Python-based code for performing propensity score (PS) matching. An initiative of the Camargo Cohort Study (Cantabria, Spain), developed with the aim of sharing the tool and spreading the use of PS matching.
The code overcomes compatibility issues with R versions and R packages, and implements (i) logistic regression to compute PS, (ii) 1:N matching using the K-nearest neighbour (KNN) algorithm with a customisable caliper, (iii) sampling with or without replacement, (iv) visualisations to assess matching quality and (v) statistics to evaluate the balance.
Outputs:
- Matched pairs stored as '.csv' file, allowing a Coxreg to be performed ('SET' in SPSS).
- Diagnostic plots stored in the specified output folder, providing a view of SMD and PS distribution.
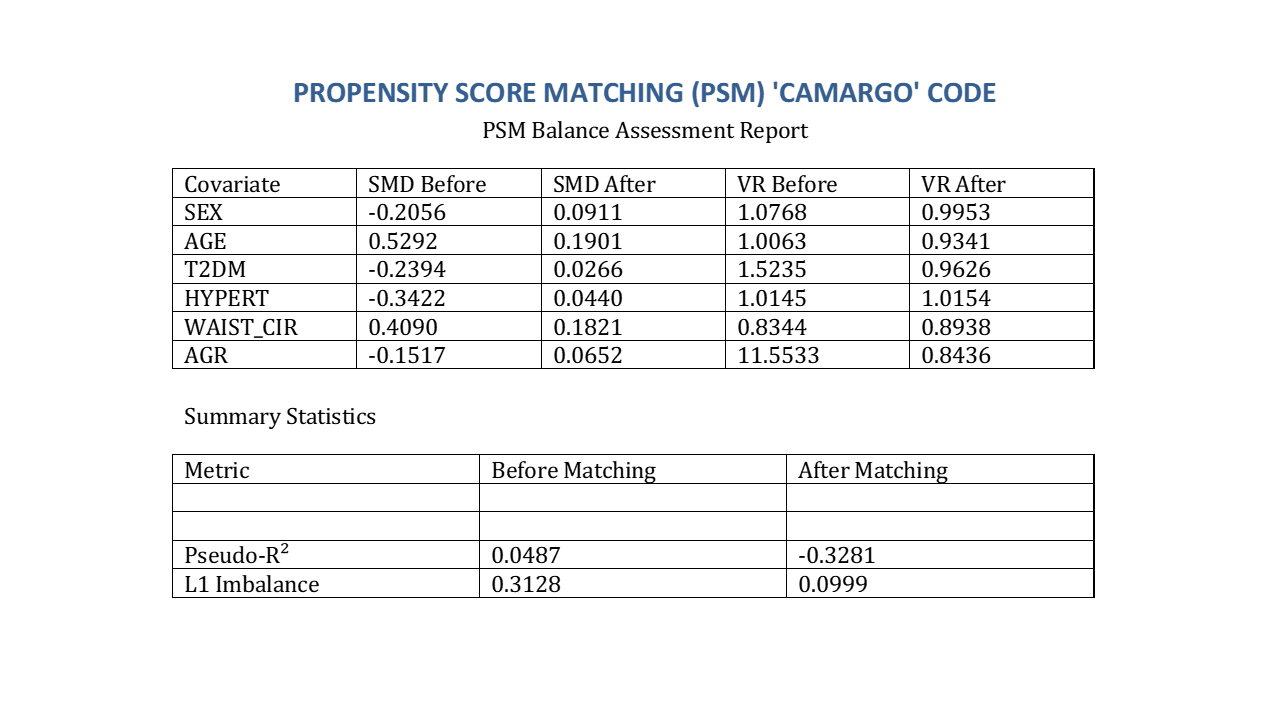
- Statistics for matching validation: SMD, variance ratio (VR), McFadden's pseudo-R², and L1 multivariate imbalance.
The code has been developed using information from the Matplotlib, Numpy and Seaborn libraries and with OpenAI's ChatGPT support and refinements.
No funding was received for conducting this work and there are no financial or non-financial interests to disclose.
***Methodological Note (updated perspective)
Subsequent applications of this PSM framework in longitudinal cardiometabolic–osteogenic research have provided additional insight into one of its most informative features. Beyond achieving balance in the covariates explicitly included in the propensity score model, the matching procedure frequently led to a meaningful reduction in the standardized mean differences of variables not directly specified in the PS equation.
This pattern, initially observed during balance diagnostics, is unlikely to be incidental. Rather, it suggests that the propensity score may capture underlying latent correlation structures embedded within interconnected cardiometabolic domains. In such contexts, balancing upstream determinants can indirectly equilibrate associated biological or structural variables that share common pathways or covariance patterns.
From a methodological standpoint, this phenomenon supports the view that well-specified PS models do not merely equalise isolated predictors but may approximate broader susceptibility architectures when the included covariates represent stable upstream determinants. This observation, while dependent on context and model specification, reinforces the interpretative value of comprehensive balance assessment beyond the primary covariates.
Example of balance dynamics before and after matching. Notably, the reduction in standardized mean differences extends beyond covariates explicitly included in the PS model, illustrating indirect equilibrium of correlated domains.
Other
|
CODE |
REPLACEMENT |
CUSTOMISABLE RATIO AND CALIPER |
MATCHED PAIRS |
PSM ASSESSMENT |
|
PS matching code 1 |
Without
|
Ratio: line 73 Caliper: line 84 |
.csv file |
SMD (barplot and lineplot) (.png) |
|
PS matching code 2 |
Without
|
Ratio: line 88 Caliper: line 89 |
.csv file |
SMD, VR and pseudo-R² (.csv, .txt) |
|
PS matching code 3 |
Without
|
Ratio: line 163 Caliper: line 168 |
.csv file |
Lineplot with improvements (.png) Balance report (SMD, VR, pseudo-R² and L1 imbalance) (.docx) |
|
|
|
|
|
|
|
PS matching code 4 |
With
|
Ratio: line 89 Caliper: line 100 |
.csv file |
SMD (barplot and lineplot) (.png) |
Notes
Notes
Files
Balance report.png
Files
(637.6 kB)
| Name | Size | Download all |
|---|---|---|
|
md5:639de8079996405e2be0ad0386d68b2a
|
25.5 kB | Preview Download |
|
md5:8441fbe8e7fca32b1a0b65d7519170f1
|
254.0 kB | Download |
|
md5:25c29a4ed1f97164ab6865eaa80df1fe
|
10.4 kB | Download |
|
md5:5436ae051adcf047b4309bd09e37084f
|
7.7 kB | Download |
|
md5:478d4a7a27e12647081563fe596ffa53
|
10.2 kB | Download |
|
md5:8c1af0c66f3d8b954af24e5a1fe51827
|
10.8 kB | Download |
|
md5:982012e6073b69e9e64d02a06fbd209b
|
60.2 kB | Preview Download |
|
md5:4132dcd992a4e6a273ce3662a9a4297d
|
47.2 kB | Preview Download |
|
md5:52b1125472fe0760979c7efe0ccea770
|
75.8 kB | Preview Download |
|
md5:88295d3cb5ce0b60e853d61ccfe6442f
|
135.8 kB | Preview Download |
Additional details
Additional titles
- Alternative title
- SUMMARY
Dates
- Updated
-
2025-03-03Python-based code for implementing PSM
Software
- Repository URL
- https://github.com/epsar-co/Propensity-Score-Matching-Python-based-code.git
- Programming language
- Python
References
- Staffa SJ, Zurakowski D. Five Steps to Successfully Implement and Evaluate Propensity Score Matching in Clinical Research Studies. Anesth Analg. 2018;127:1066-1073. doi: 10.1213/ANE.0000000000002787.
- Thoemmes, F. Propensity score matching in SPSS. 2012. Available at: https://arxiv.org/pdf/1201.6385.
- Stuart EA. Matching methods for causal inference: A review and a look forward. Stat Sci. 2010;25:1-21. doi: 10.1214/09-STS313.
- Brookhart MA, Schneeweiss S, Rothman KJ, Glynn RJ, Avorn J, Stürmer T. Variable selection for propensity score models. Am J Epidemiol. 2006;163:1149-56. doi: 10.1093/aje/kwj149.
- Austin PC. An Introduction to Propensity Score Methods for Reducing the Effects of Confounding in Observational Studies. Multivariate Behav Res. 2011 May;46(3):399-424. doi: 10.1080/00273171.2011.568786.
- Zhang Z, Kim HJ, Lonjon G, Zhu Y; written on behalf of AME Big-Data Clinical Trial Collaborative Group. Balance diagnostics after propensity score matching. Ann Transl Med. 2019 Jan;7(1):16. doi: 10.21037/atm.2018.12.10.