Published March 5, 2025
| Version v1
Figure
Open
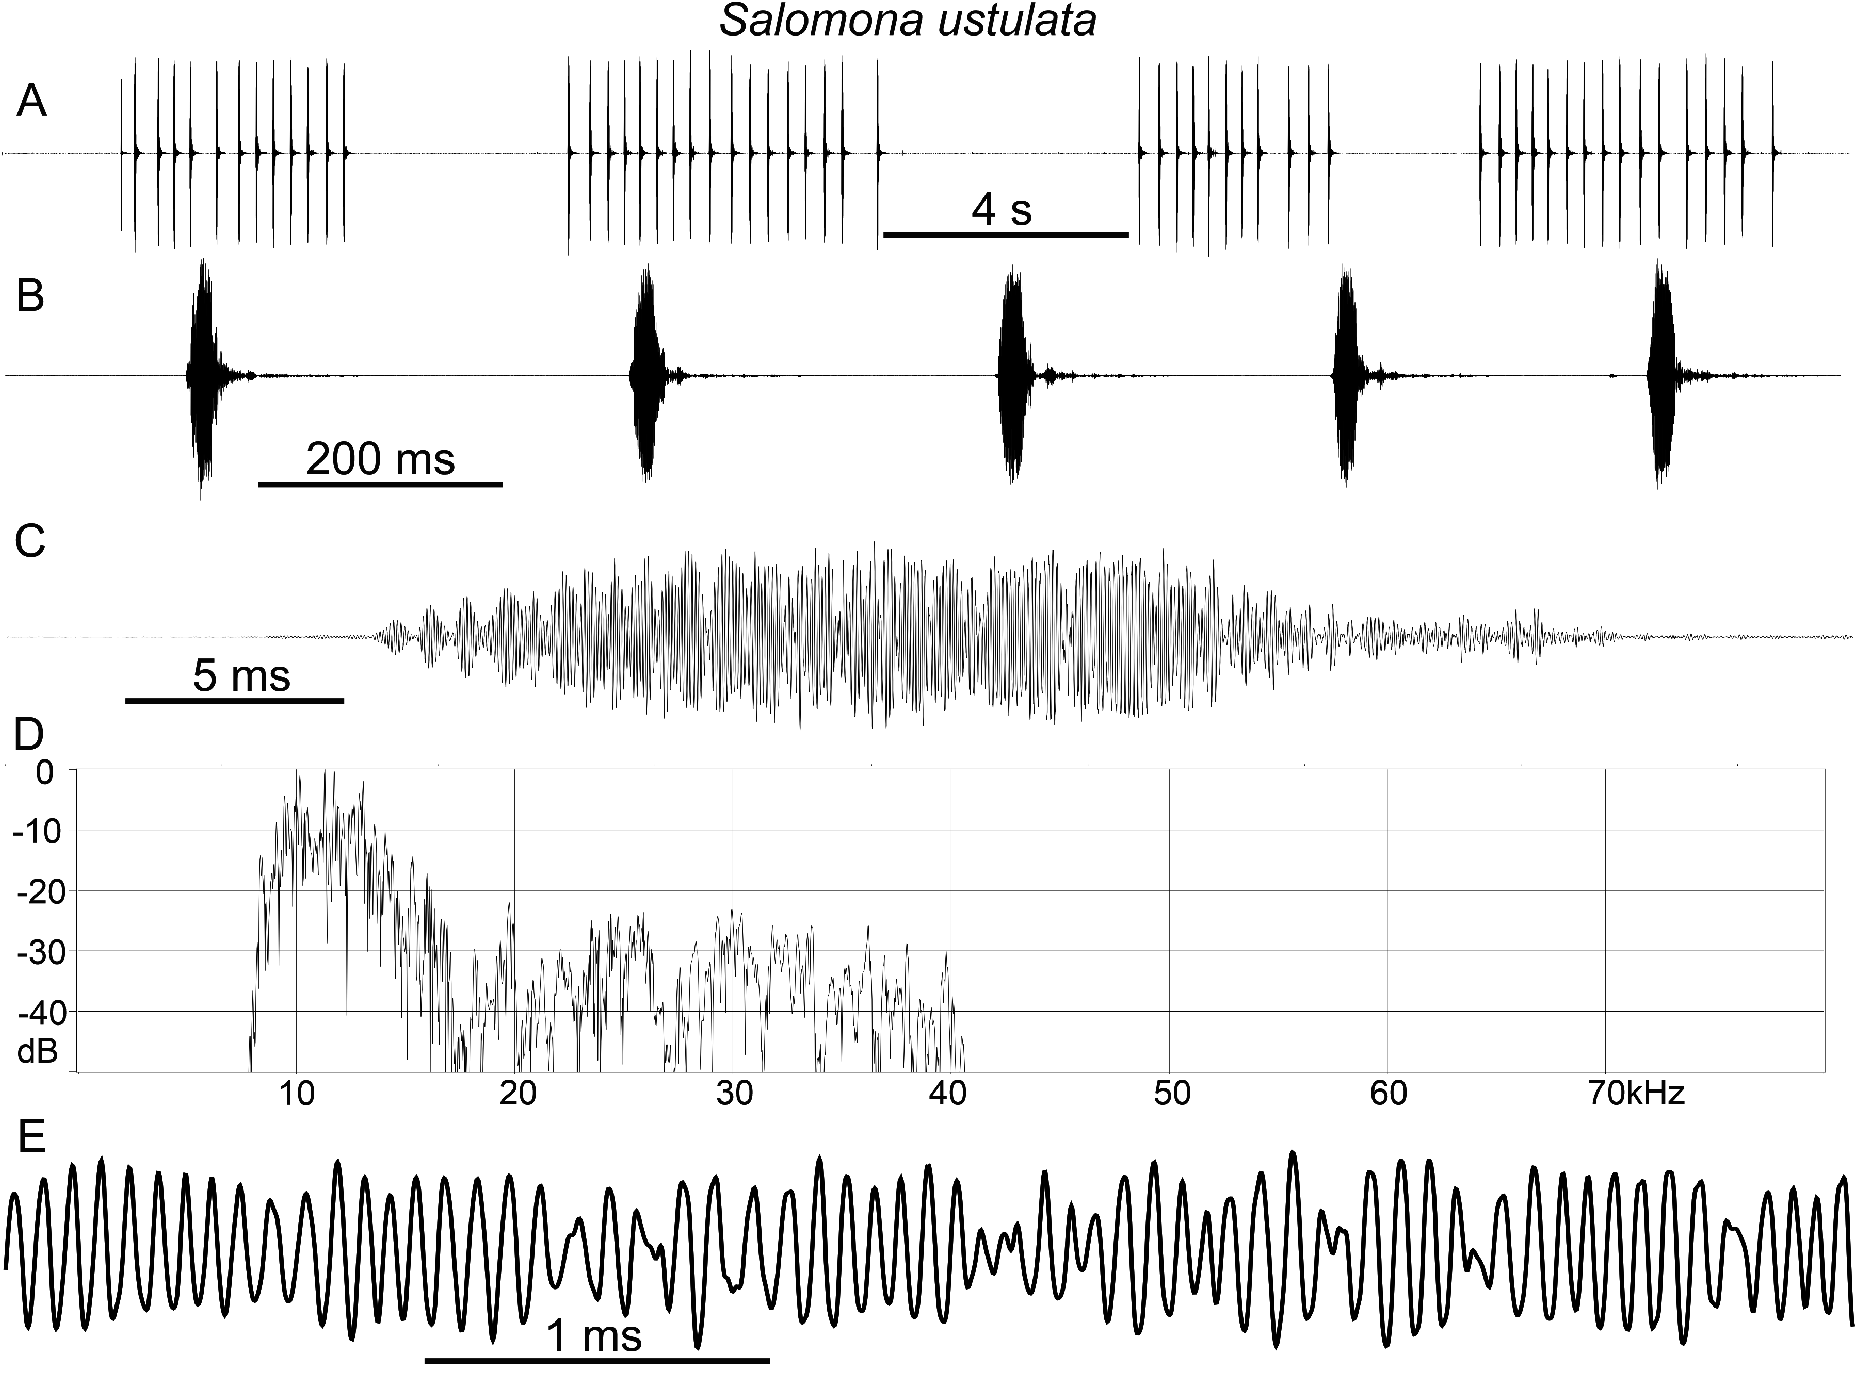
FIGURE 52. S in Stridulation songs of some Tettigoniidae (Ensifera, Orthoptera) from Papua New Guinea
Creators

- 1. Department of Biology, University of Toronto Mississauga, 3359 Mississauga Rd., ON, L5L1C6, Canada. glenn.morris@utoronto.ca; https://orcid.org/0000-0001-7463-1313
- 2. Leibniz Institute for the Analysis of Biodiversity Change; Museum Koenig, Adenauerallee 160, D-53113 Bonn, Germany. s.ingrisch@macbay.de; https://orcid.org/0000-0002-8624-0472
- 3. Laurastraat 67, NL-6471 JH Eygelsshoven, Netherlands
- 4. Naturalis Biodiversity Center, Darwinweg 2, 2333 CR Leiden. luc.willemse@naturalis.nl; https://orcid.org/0000-0003-0517-9778
- 5. School of Chemistry, Environmental & Life Sciences, The University of The Bahamas, Nassau, Bahamas. paul.deluca@ub.edu.bs; https://orcid.org/0000-0003-4578-979X
- 6. Department of Biology, University of Toronto Mississauga, 3359 Mississauga Rd., ON, L5L1C6, Canada. glenn.morris@utoronto.ca; https://orcid.org/0000-0001-7463-1313 & 264 Victoria St., Mississauga ON, L5M1J8 Canada *Corresponding author †Deceased & Department of Biology, University of Toronto Mississauga, 3359 Mississauga Rd., ON, L5L1C6, Canada. glenn.morris@utoronto.ca; https://orcid.org/0000-0001-7463-1313
Description
FIGURE 52. S. ustulata acoustic analysis: A) Four calling bouts at coarse time resolution. [dorsal aspect 11.5 cm 20°C, QMC]; song resolved by human ear as a succession of ticks; B) showing 5 such ticks; C) high resolution of one tick showing erratic amplitude envelope and run-on multiple tooth-event waveforms; D) Fourier spectrum has highest intensity audio band 8–16 kHz with lower intensity ultrasonics up to 40kHz; E) at high resolution waves almost suggesting resonance stridulation.
Notes
Files
figure.png
Files
(340.8 kB)
| Name | Size | Download all |
|---|---|---|
|
md5:56fc6c7ed50807db54d47ae3f7b5c403
|
340.8 kB | Preview Download |