Published November 25, 2024
| Version v1
Image
Open
Charachterising the molecular line emission in the asymmetric Oph-IRS 48 dust trap: Temperatures, timescales, and sub-thermal excitation

Description
This repository contains the appendix figure of the paper: "Charachterising the molecular line emission in the asymmetric Oph-IRS 48 dust trap: Temperatures, timescales, and sub-thermal excitation".
The figures are numbered based on how they appeared in the initial arxiv version (2411.12418, after the paper has been accepted for publication in Astronomy & Astrophysics).
The table below contains the caption for each figure:
| File name | Appendix figure | Caption |
| D1.png | D.1 | Intensity ratios between the observations and the model for SO2 (left) and CH3OH (right). The horizontal bar indicates a value of unity. The colour bar indicates the values for the Einstein-A coefficients of the transitions. |
| D2.png | D.2 | Uncertainty maps for the derived rotational temperatures. The left panels display the upper uncertainties, while the right panels show the lower uncertainties. The derived temperature maps themselves are shown in the middle panels. The top row corresponds to SO2, while the bottom row displays those for CH3OH. |
| D3.png | D.3 | Similar as Figure D.2, but for the column density maps. |
| E1.png | E.1 | Moment-0 map of the H2CO J=5(0,5)-4(0,4) transition from the low resolution observations of van der Marel et al. (2021) (left) and the J=5(1,5)-4(1,4) transition from the higher resolution observations of Booth et al. (2024), imaged both with the Briggs weighting (robust of 0.5, middle panel) and superuniform weighting (right). The white star indicates the approximate location of the host star, while the resolving beam is shown in the lower left corner. |
| F1.png | F.1 | Number of detected transitions for SO2 (left), CH3OH (middle), and H2CO (right) across the dust trap. |
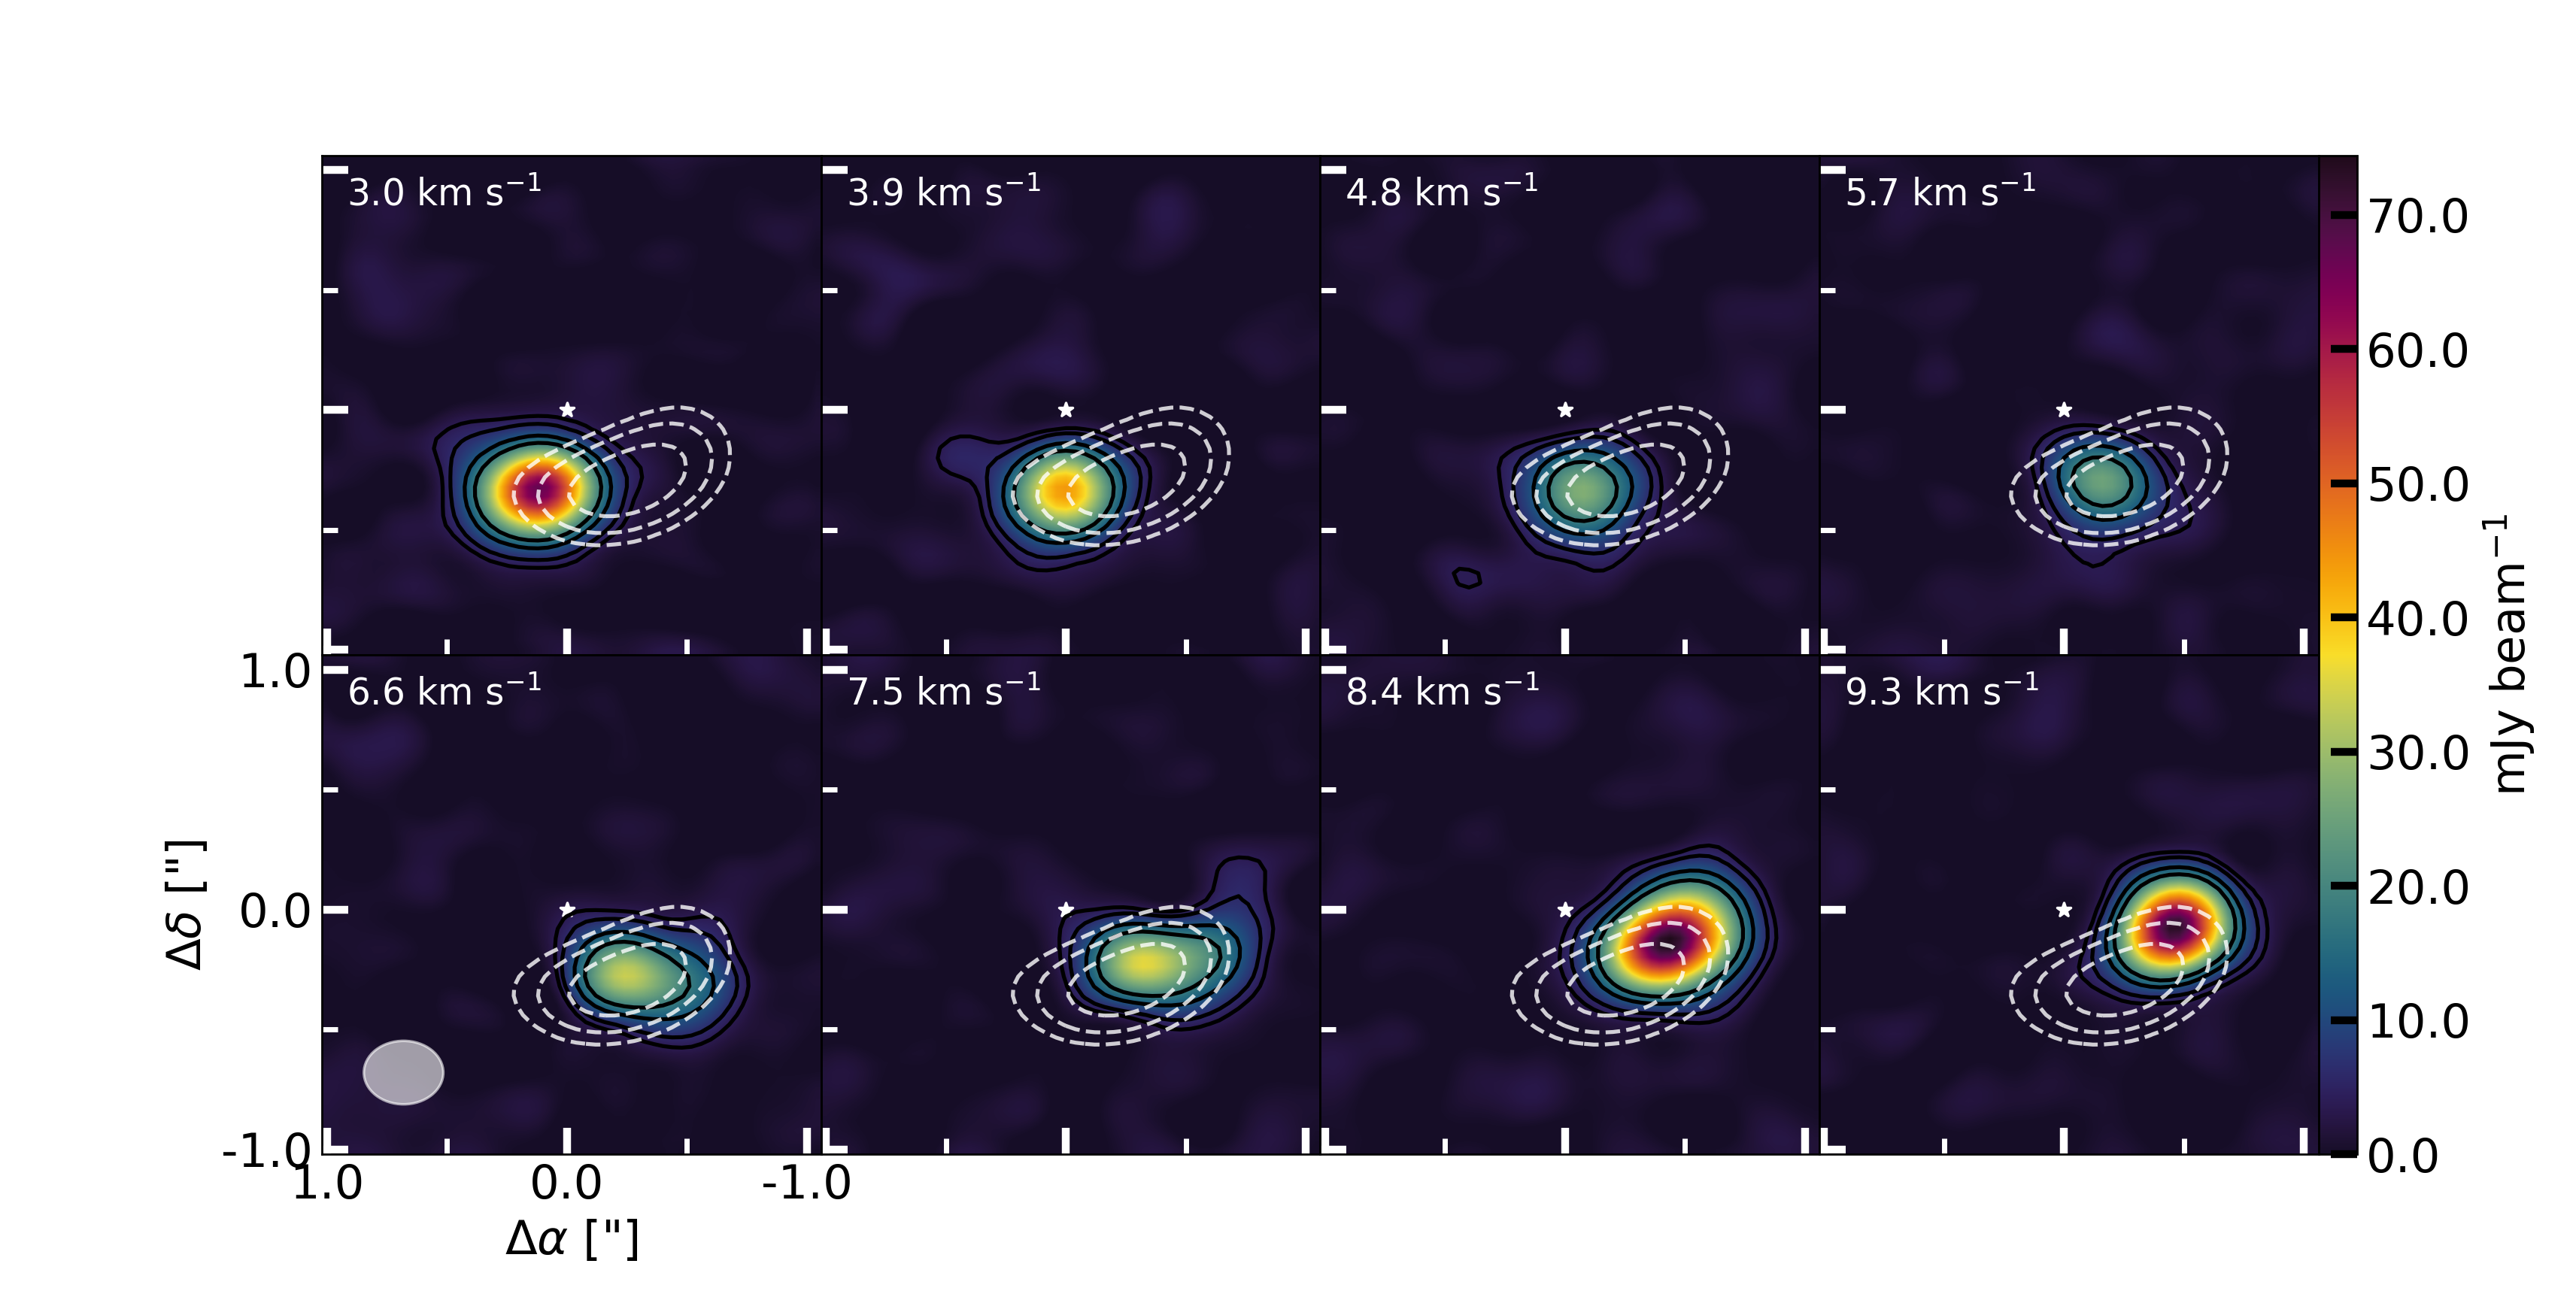
| G1.png | G.1 | Channel maps of SO2 over the 3.0-9.3 km/s range. The solid contour indicate the 3x and 5x (both in red) and the 199x and 15x (both in black) RMS levels of the emission, whereas the white dashed contours indicate the location of the continuum emission. The white star indicates the location of the host star, whereas the grey ellipse denotes the resolving beam. |
| G2.png | G.2 | Same as Figure G.1 but for CH3OH. |
| G3.png | G.3 | Same as Figure G.1 but for H2CO. |
| H1.png | H.1 | The turbulent diffusion coefficient (in cm^2/s, top panel) and the vertical mixing timescale (bottom panel) according to the DALI models of Leemker et al. (2023). The coefficient and the timescale have been calculated for alpha values of 10^-4 (left panels), 10^-3 (middle panels), and 10^-2 (right panels). |
| H2.png | H.2 | The desorption (top panels) and freeze-out (bottom panels, only showing t_{freeze_out}<t_{desorption}) for SO2 (left panels), CH3OH (middle panels), and H2CO (right panels) following the DALI model of Leemker et al. (2023). |
| H3.png | H.3 | The photodissociation timescales (top panels) and the azimuthal distances (by Keplerian motion) the molecules can travel before they get photodissociated (bottom panels) basedo n the DALI model of Leemker et al. (2023). From left to right, the timescales and distances are shown for SO2, CH3OH, and H2CO, respectively. |
Files
D1.png
Files
(9.8 MB)
| Name | Size | Download all |
|---|---|---|
|
md5:fecc842347624faa2cc3fe40af8204d4
|
131.2 kB | Preview Download |
|
md5:3520182e75299845b655faf14c4a148a
|
1.2 MB | Preview Download |
|
md5:b6177fb540f46d6b1214861709903254
|
1.6 MB | Preview Download |
|
md5:f6dd434e722f27a5a2cd0bb3e689a56b
|
898.7 kB | Preview Download |
|
md5:db72061abc529ddc8281d15134e6e9c9
|
587.8 kB | Preview Download |
|
md5:6d4311a692b98ed0878e1dfe606944fb
|
1.4 MB | Preview Download |
|
md5:04092b507762f94bb62d61f595d3b65c
|
1.5 MB | Preview Download |
|
md5:9dfe5609f00afc1d76cfb8f7e3a5c13c
|
1.0 MB | Preview Download |
|
md5:f4192c3b9e5dcd472870d2b74fa6c2ff
|
374.0 kB | Preview Download |
|
md5:90cfbe08a5916099517500df9218a657
|
556.5 kB | Preview Download |
|
md5:2b16846ecdc519c4d74b5aa566969ede
|
613.1 kB | Preview Download |
Additional details
Related works
- Is supplement to
- Journal article: arXiv:2411.12418 (arXiv)