Single-cycle, 643-mW average power THz source based on tilted pulse front in lithium niobate

-
1.
 Ruhr University Bochum
- 2. Photonics and Ultrafast Laser Science (PULS)
Description
This data set is associated with the aforementioned paper.
The data and the Jupyter notebooks (Python) to reproduce the figures in this paper can be downloaded below. To run a Jupyter notebook as a beginner, it is easiest to download and install anaconda, a Python environment that comes with many packages preinstalled and also offers Jupyter lab/notebook. It is available at https://www.anaconda.com/download.
Fig.01
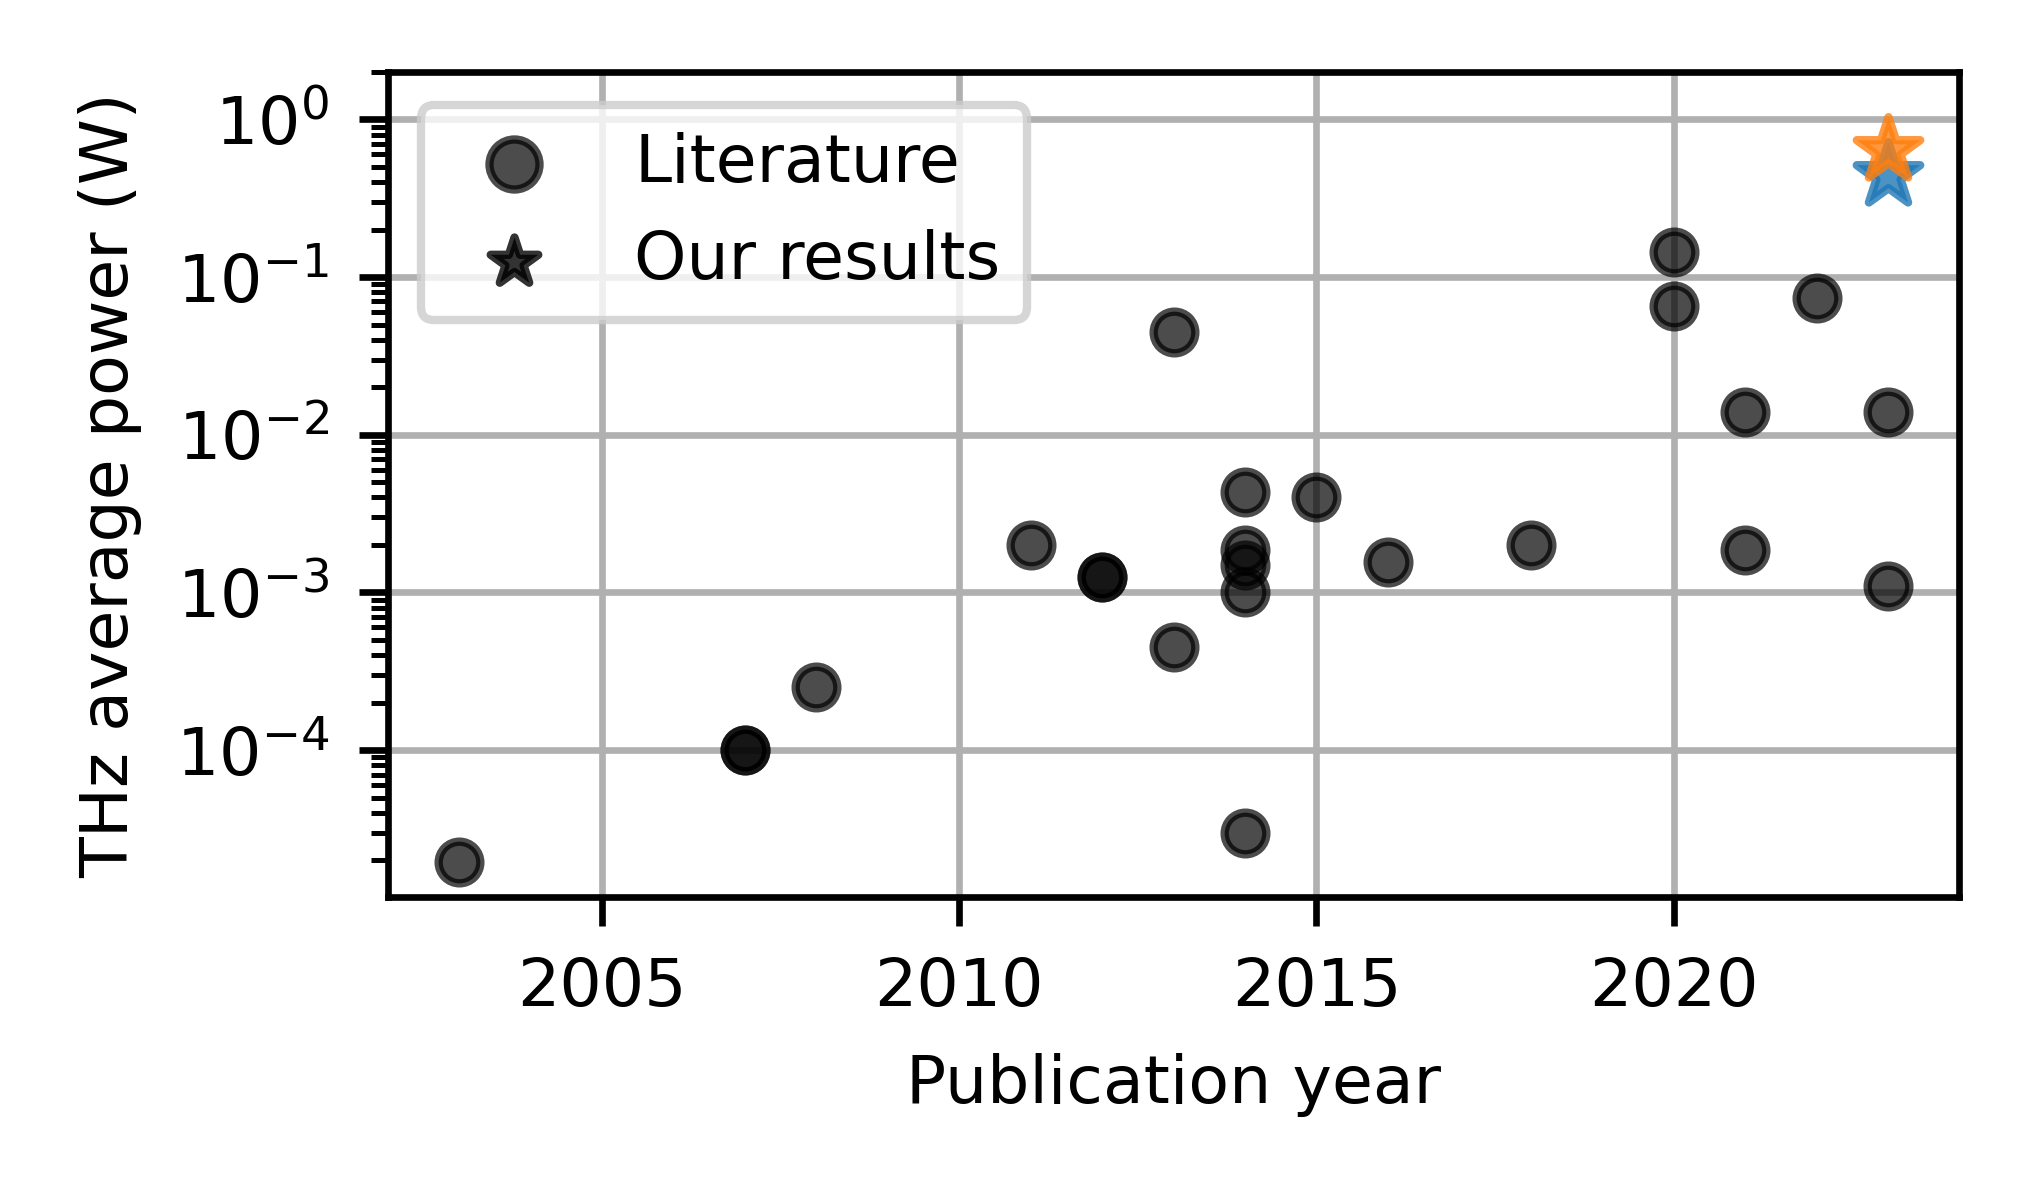
Fig.01_literature_lithium_niobate_sources.csv contains a summary table of the last decades of published THz power values obtained with lithium niobate in the tilted pulse front geometry. The accompanying jupyter notebook allows to reproduce the figure that was used in the paper.
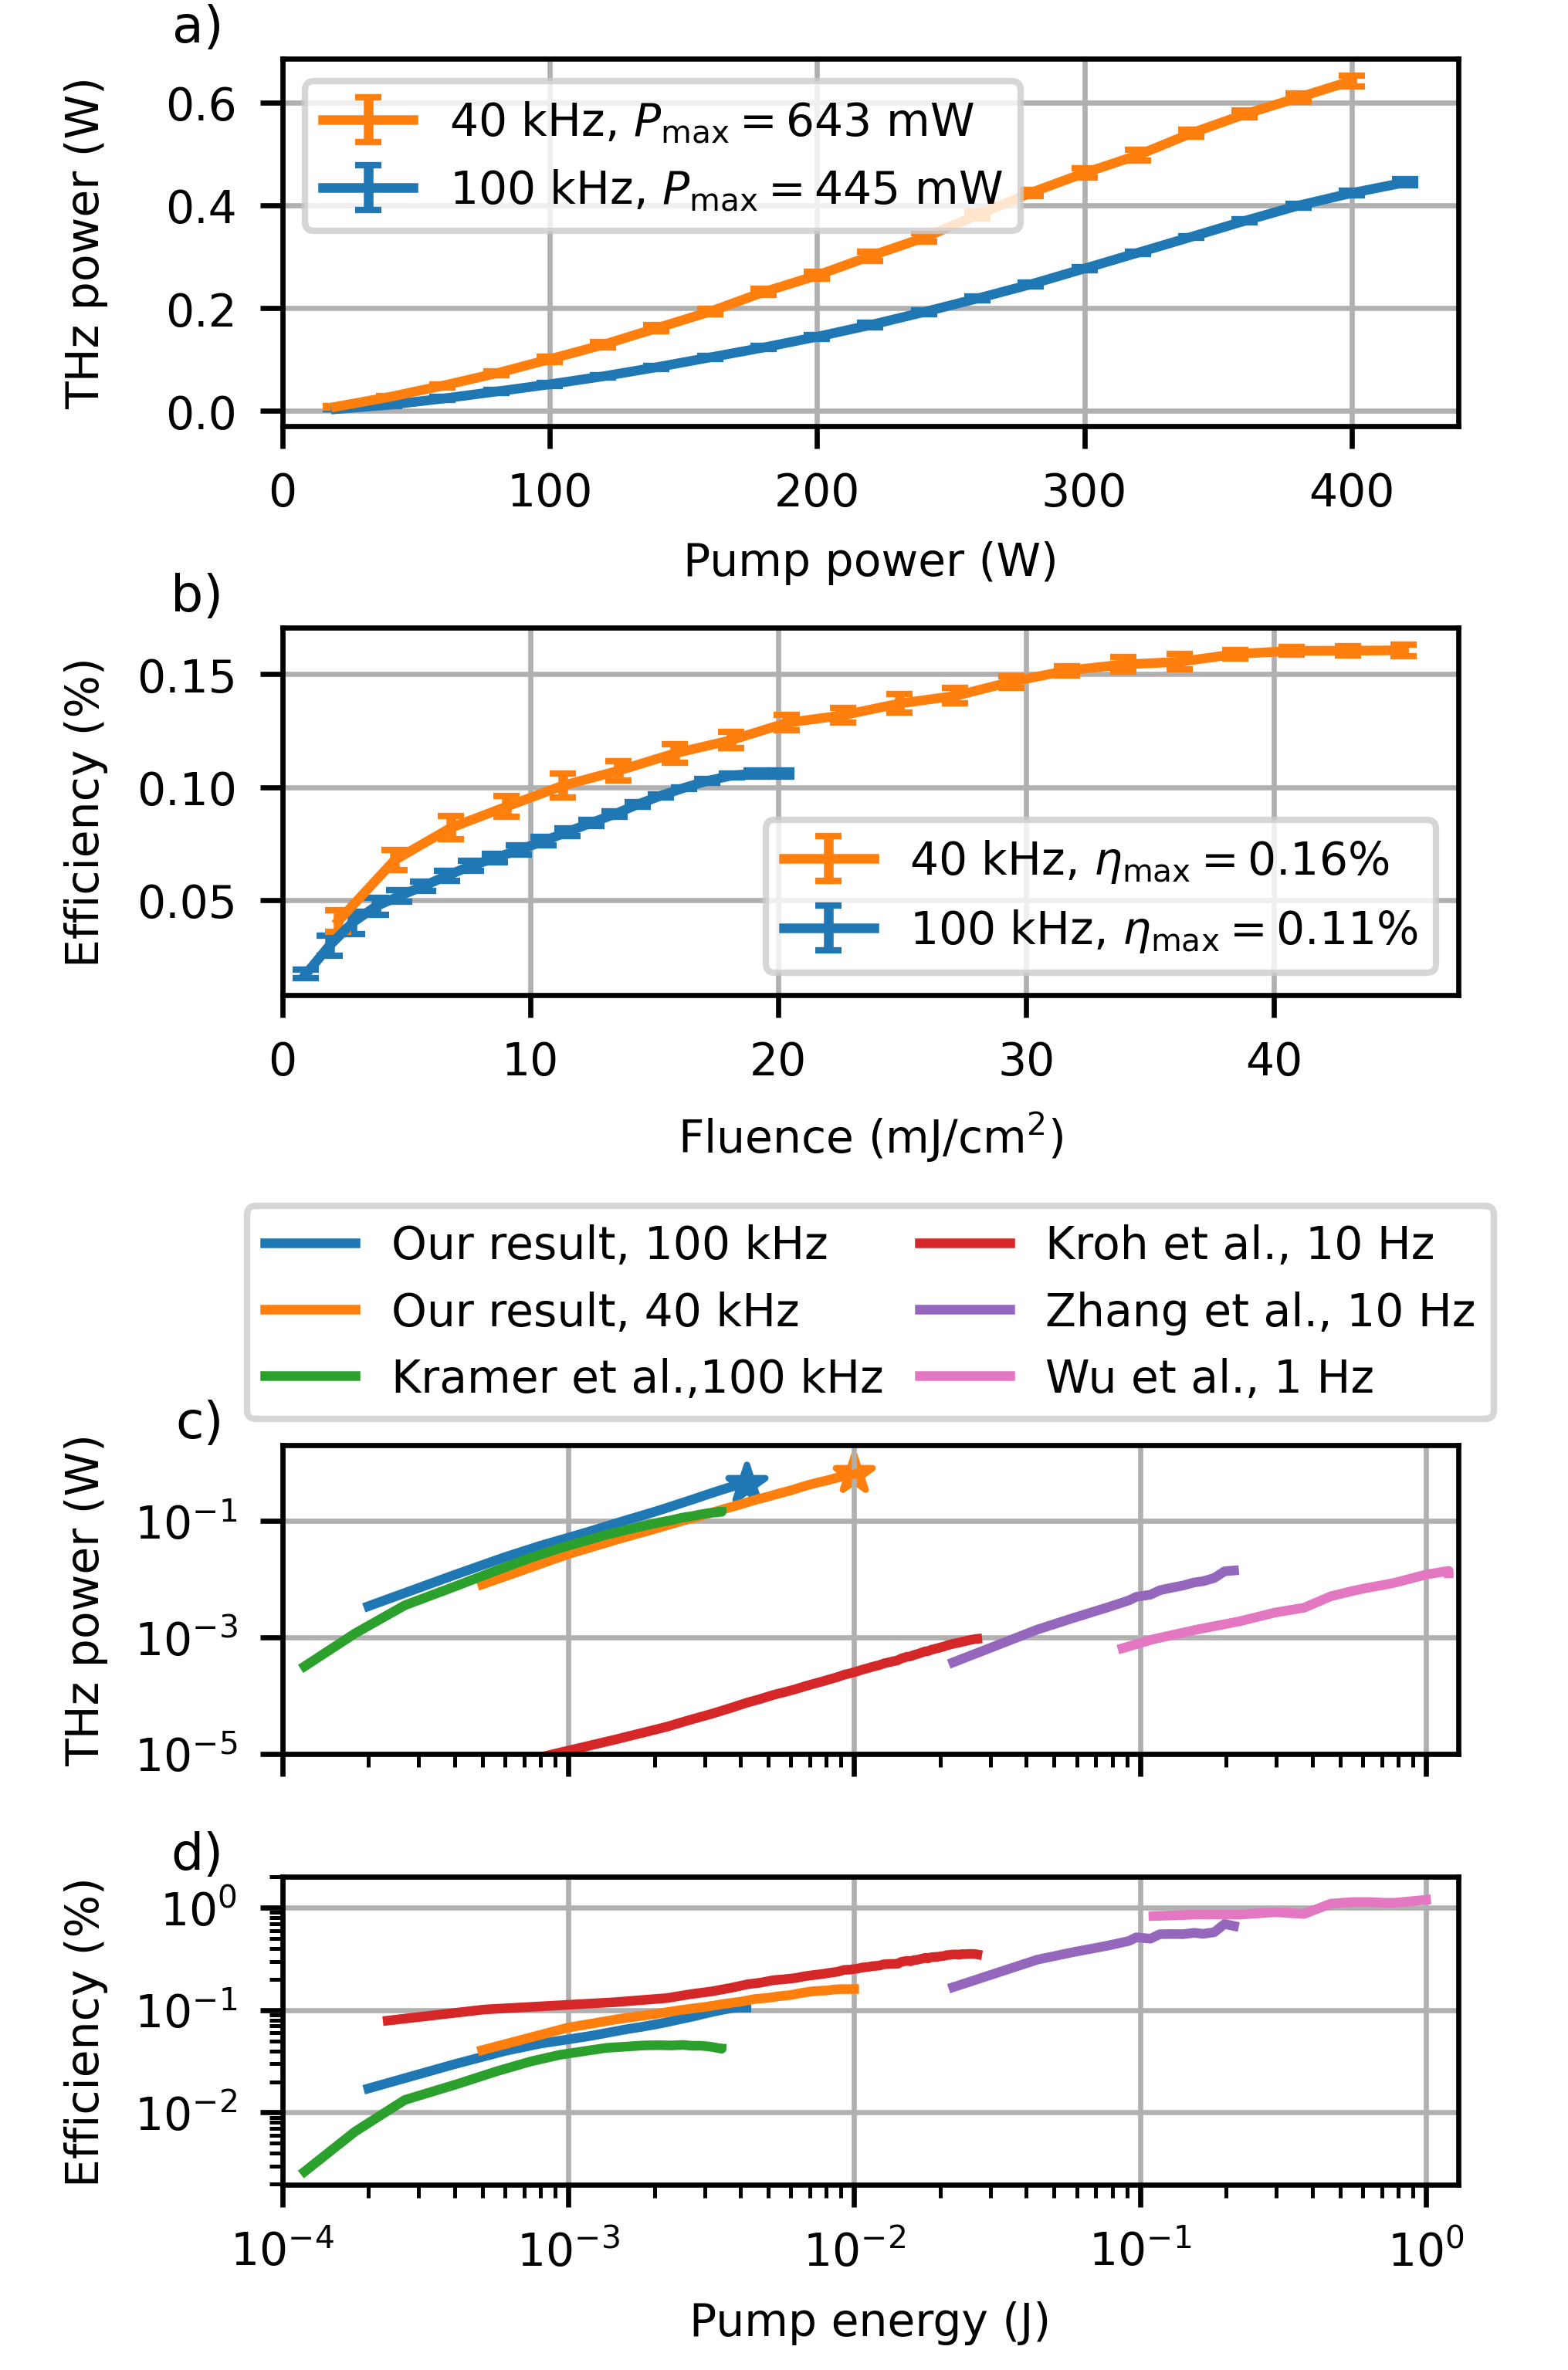
Fig.03
Each individual data frame (df), which is saved as an HDF file in the .zip file, contains a "power curve" measurement (i.e. measured THz power as a function of the applied pump power). Whenever a parameter is changed, all positions, angles, THz power and cryostat parameters are saved.
- x1 is the position of the last mirror before the transmission grating (parallel to the pump beam direction before the crystal) in [mm]
- x2 is the position of the first imaging lens in direction of the pump beam propagation direction before the crystal in [mm]
- x3 is the position of the second imaging lens in the direction of the pump beam propagation direction before the crystal in [mm]
- x4 is the position of the cryostat in the direction of the pump beam before reaching the crystal in [mm]
- y0 is the position of the cryostat in the perpendicular direction of the pump beam before reaching the crystal in [mm]
- α0 is the angle of the lambda/2 waveplate that allows the pump power to be varied at the crystal in [°]
- α1 is the angle of the last mirror before the grating in [°]
- α2 is the angle of the transmission grating in [°]
- thz_power_W is the obtained power obtained from the Ophir 3A-P-THz power meter in [W]
- temperature_setpoint_K is the LakeShore cryostat controller setpoint in [K]
- temperature_K is the temperature read from the sensor on the cooling finger (above the crystal) in [K]
- heater_output is the amount of power in [%] delivered to the resistive heating element inside the cryostat. 100% corresponds to about 50 W. Its value is controlled by an internal PID loop of the cryostat controller, which tries to stabilize temperature_K to temperature_setpoint_K
- pump_power is the average laser power reaching the crystal in [W]. It was calibrated before obtaining the data set by characterizing the lambda/2 waveplate angle α0 to the value of an NIR power meter just before the cryostat.
- repetition_rate is the repetition rate of the laser in [Hz]
As an example, below is one line (for one pump power) of such a data frame:
| x1 | x2 | x3 | x4 | y0 | α0 | α1 | α2 | thz_power_W | temperature_setpoint_K | temperature_K | heater_output | pump_power | repetition_rate | |
|---|---|---|---|---|---|---|---|---|---|---|---|---|---|---|
| 0 | -12.000005 | 2.500039 | 9.100015 | -5.0 | -2.0 | 35.905660 | 25.68 | -23.3 | 0.006000 | 80.0 | 79.883 | 4.4 | 20.0 | 40000.0 |
10 of such power curves were obtained at 100 kHz and 40 kHz and can be found in the respective zip-file.
Literature_Power_Efficiency.zip contains digitzed power and efficiency values from the following references:
- X. Wu, D. Kong, S. Hao, et al., "Generation of 13.9-mJ Terahertz Radiation from Lithium Niobate Materials," Advanced Materials 35, 2208947 (2023).
-
P. L. Kramer, M. K. R. Windeler, K. Mecseki, et al., "Enabling high repetition rate nonlinear THz science with a kilowatt-class sub-100 fs laser source," Opt. Express 28, 16951 (2020).
-
T. Kroh, T. Rohwer, D. Zhang, et al., "Parameter sensitivities in tilted-pulse-front based terahertz setups and their implications for high-energy terahertz source design and optimization," Opt. Express, OE 30, 24186–24206 (2022).
-
B. Zhang, Z. Ma, J. Ma, et al., "1.4-mJ High Energy Terahertz Radiation from Lithium Niobates," Laser & Photonics Reviews 15, 2000295 (2021).
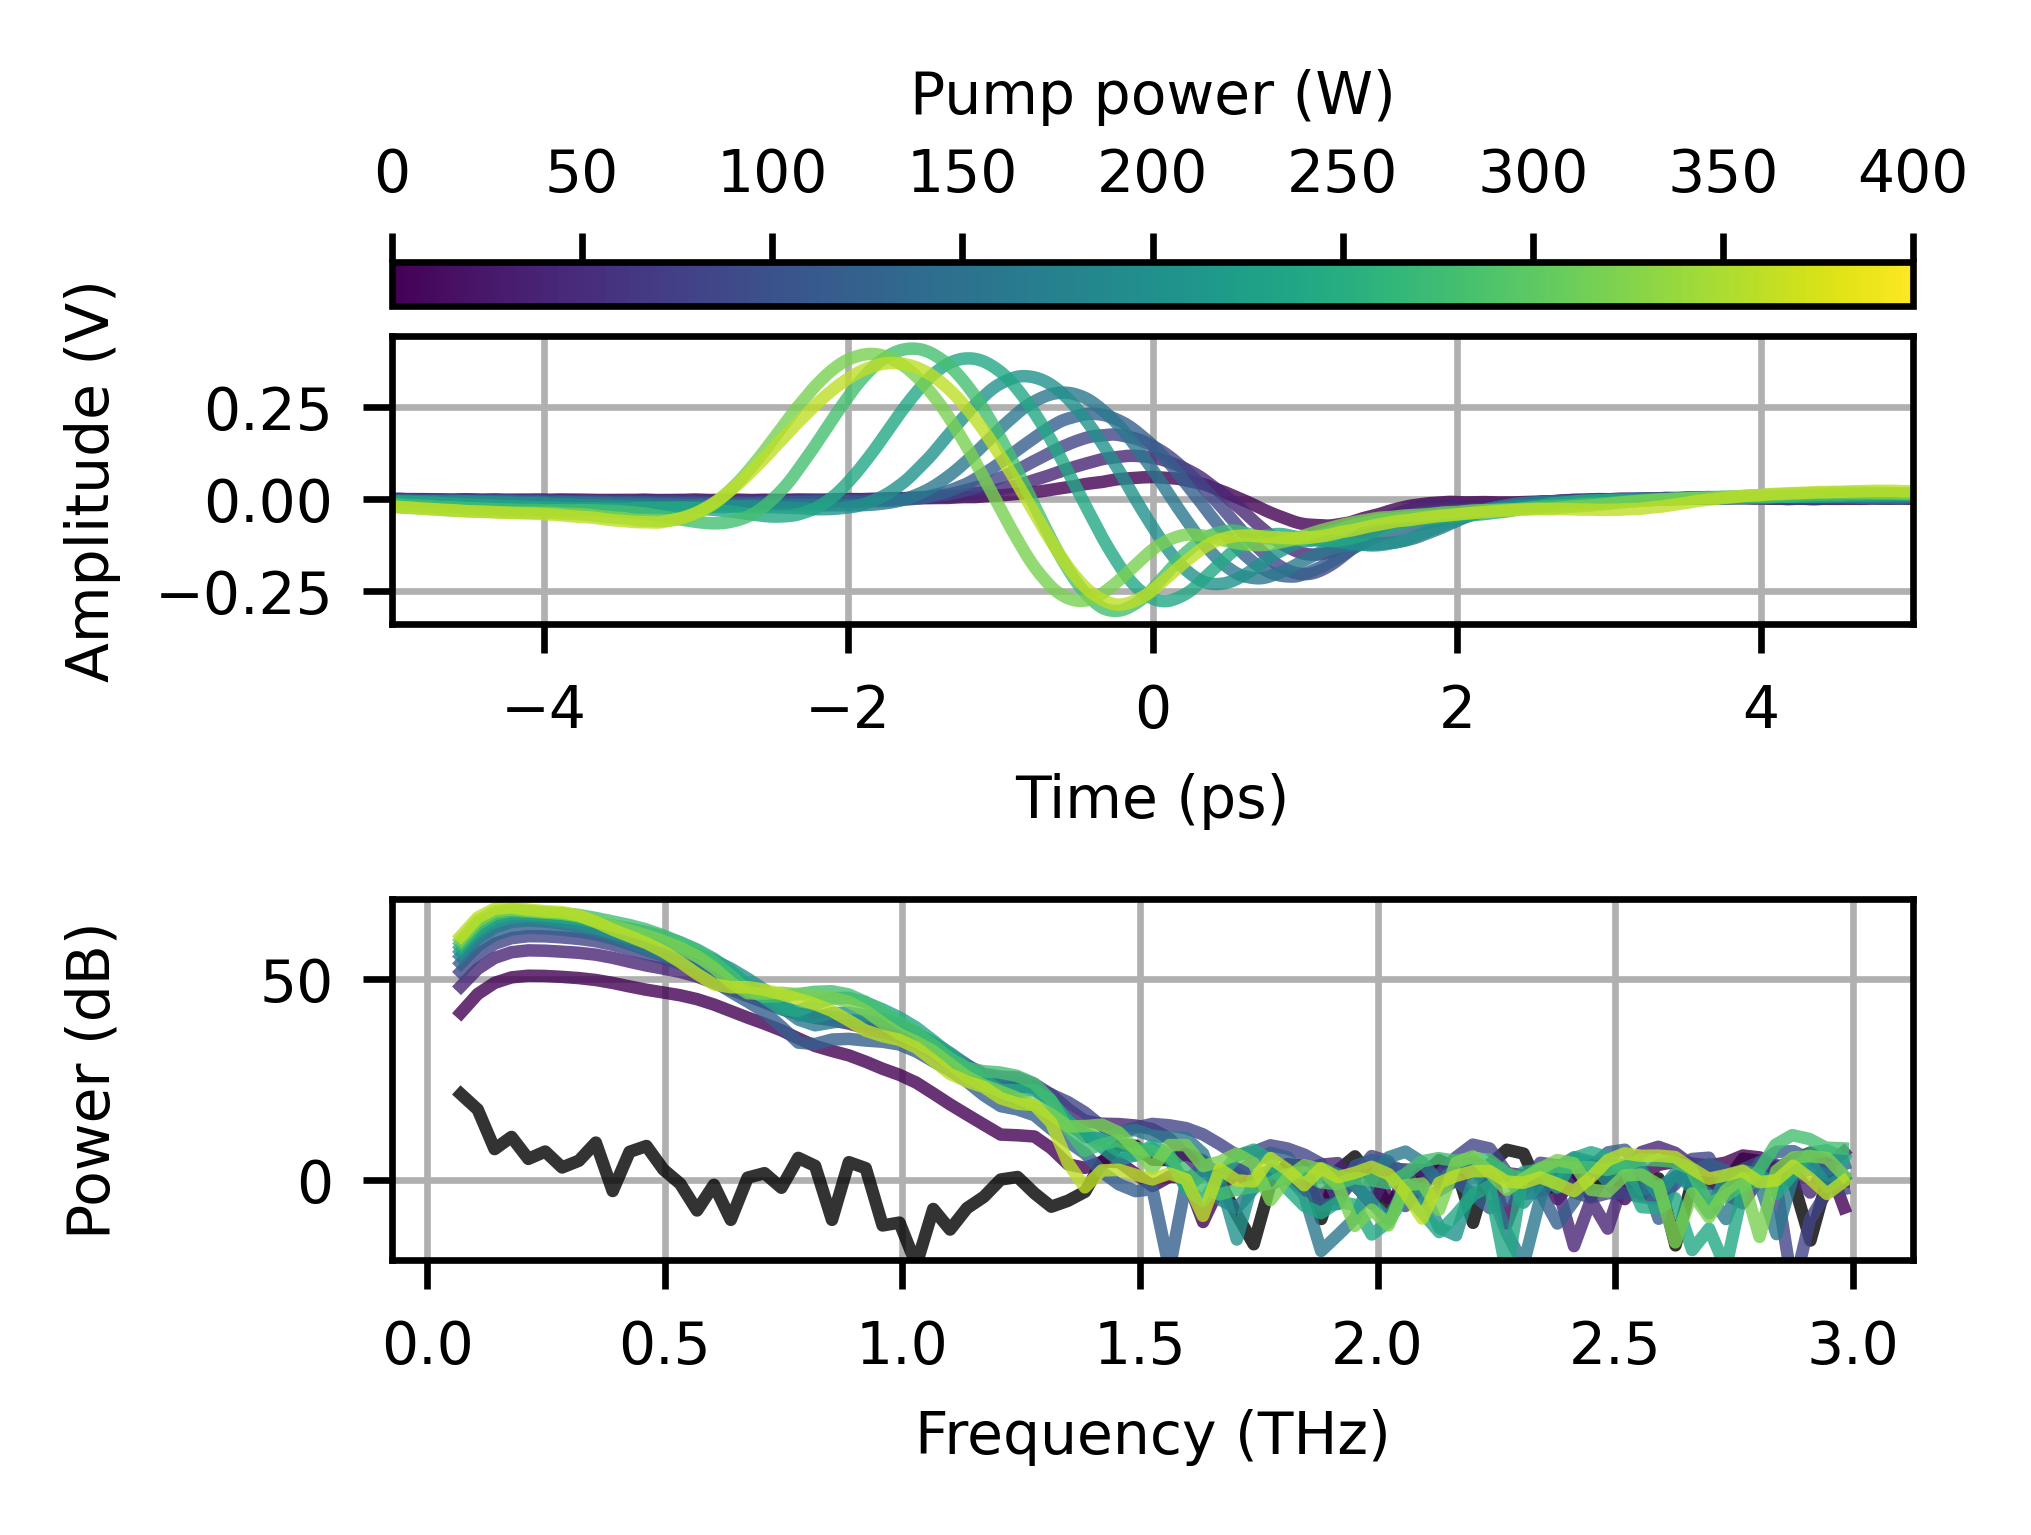
Fig.04
EOS_dfs.p is a pickle file, contain electro-optic sampling traces, which are already averaged for various pump powers at 40 kHz repetition rate.
Files
Fig.01.ipynb
Files
(30.0 MB)
| Name | Size | Download all |
|---|---|---|
|
md5:f18e3e3b5702768ab29bcc855703914b
|
28.8 MB | Download |
|
md5:b5d8b5675b5d4fe66eb3edaa08578c85
|
67.1 kB | Preview Download |
|
md5:cd21b58f6eec127fdaaa7be93098bdfc
|
9.9 kB | Preview Download |
|
md5:da3c8879aa3b3ea76facc143633673cb
|
151.3 kB | Preview Download |
|
md5:8c623ecdc851d9d42f7466a5a250ba62
|
85.5 kB | Preview Download |
|
md5:226d4a61282c2561dda63c75b181fc99
|
378.5 kB | Preview Download |
|
md5:bdde44e60362449332f96cda888340e7
|
60.5 kB | Preview Download |
|
md5:15a7c355faa6821383d661ffe9648636
|
368.2 kB | Preview Download |
|
md5:c4e04496b8798e052c18ac655a47273a
|
6.2 kB | Preview Download |
|
md5:b794efb44d306ce7c13f4ac531235d2c
|
31.5 kB | Preview Download |
|
md5:d336572c6b823d6237eb7a0cbeb4a760
|
19.3 kB | Preview Download |
Additional details
Funding
Dates
- Submitted
-
2024-06-05to Optics Letters