Published December 31, 2022
| Version v1
Figure
Open
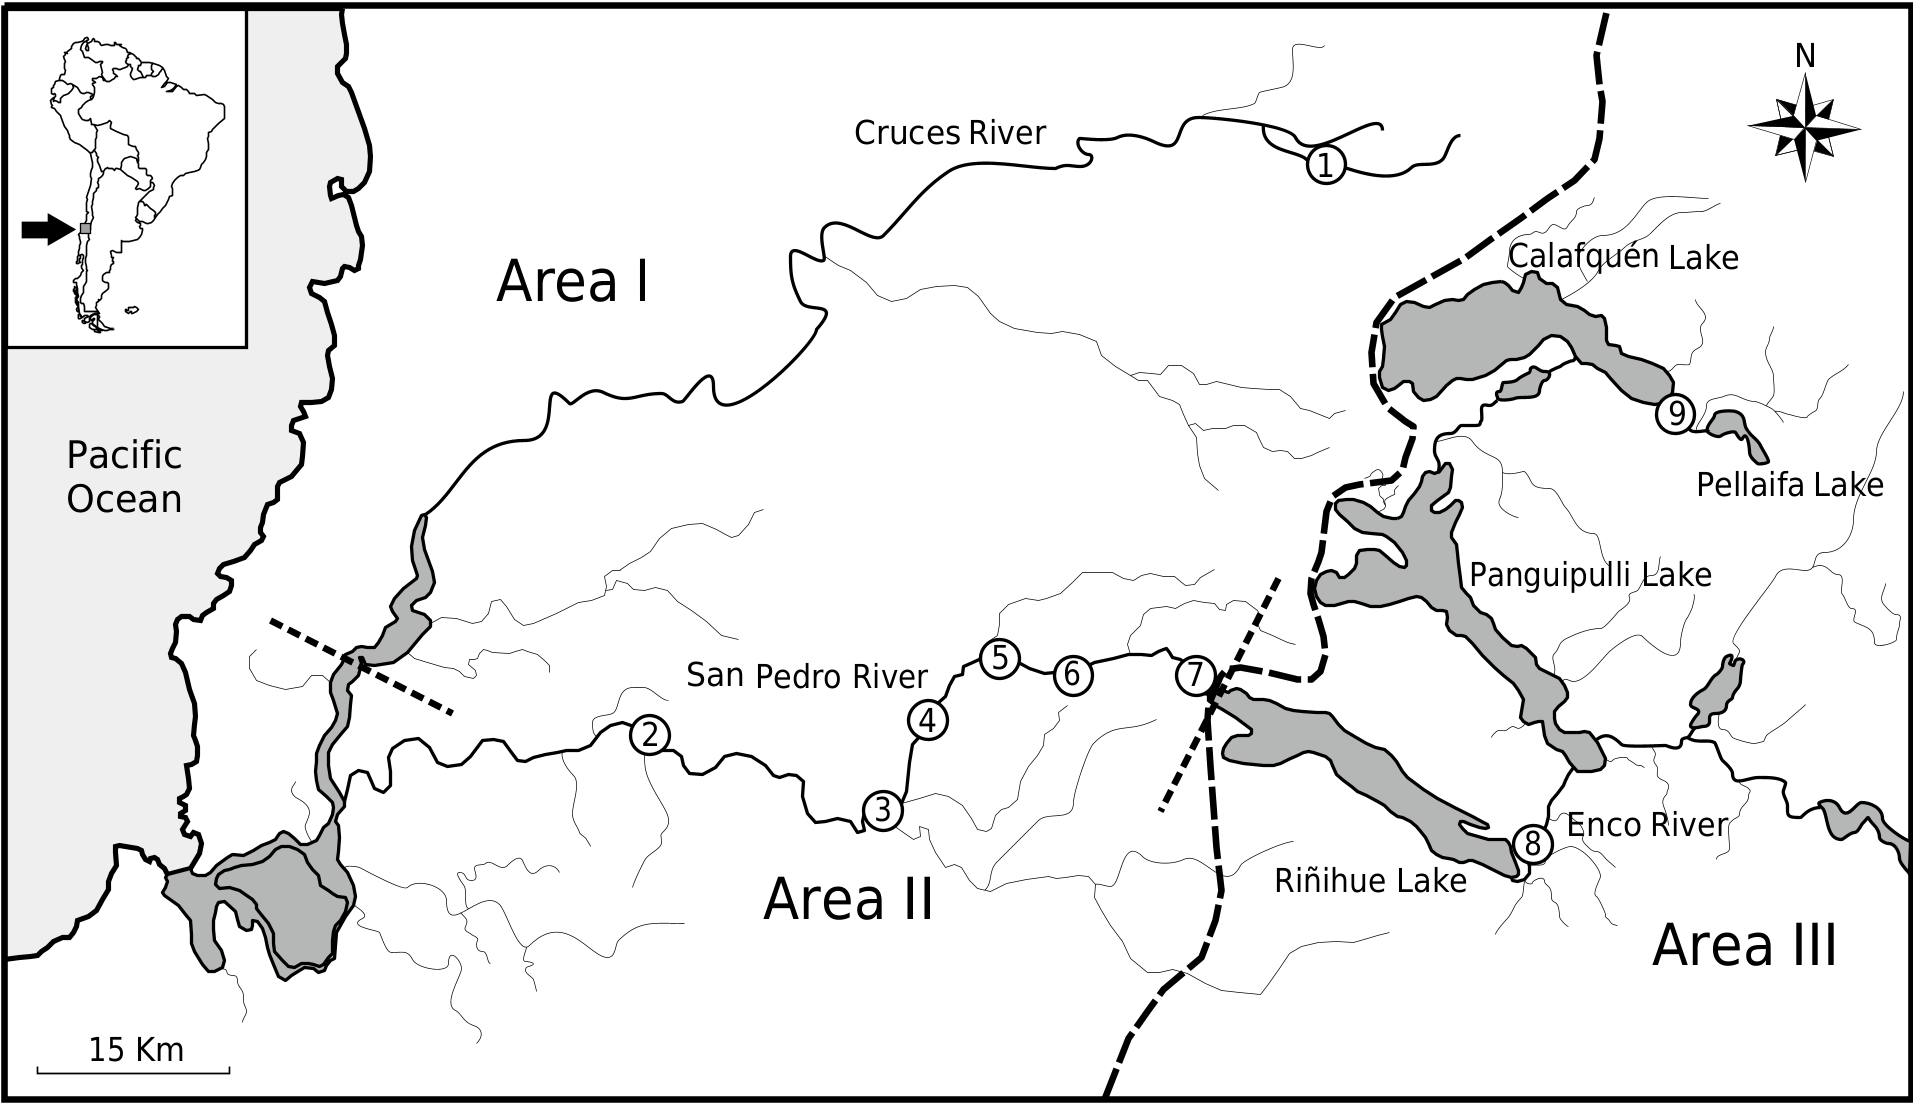
Fig. 1 in Echinoderes galadrielae Grzelak & Sørensen 2022, sp. nov.
Creators
Description
Fig. 1. Map showing location sampling and defined Areas within the Valdivia Basin. Main Areas are separated by short straight dashed lines. Population codes (numbers) are described in Table 1. Long dashed line indicates the western limit of the LGM ice sheet based on Hulton et al. (2002).
Notes
Files
figure.png
Files
(434.6 kB)
| Name | Size | Download all |
|---|---|---|
|
md5:4581f073c5750d777947551dd20699a7
|
237.9 kB | Preview Download |
|
md5:b2f99d5197373cd7446ce37a6756703d
|
196.7 kB | Download |
Linked records
Additional details
Related works
- Is part of
- Journal article: 10.5281/zenodo.7225407 (DOI)
- Journal article: urn:lsid:plazi.org:pub:FFBC1968FFE8FFE6FFAE0921243E2539 (LSID)