Published October 4, 2022
| Version v1
Figure
Open
Fig. 7.30 in Analysis of Soundscapes as an Ecological Tool
- 1. Centre for Marine Science and Technology, Curtin University, Perth, WA, Australia
- 2. Centro Interdisciplinare di Bioacustica e Ricerche Ambientali, University of Pavia, Pavia, Italy
Description
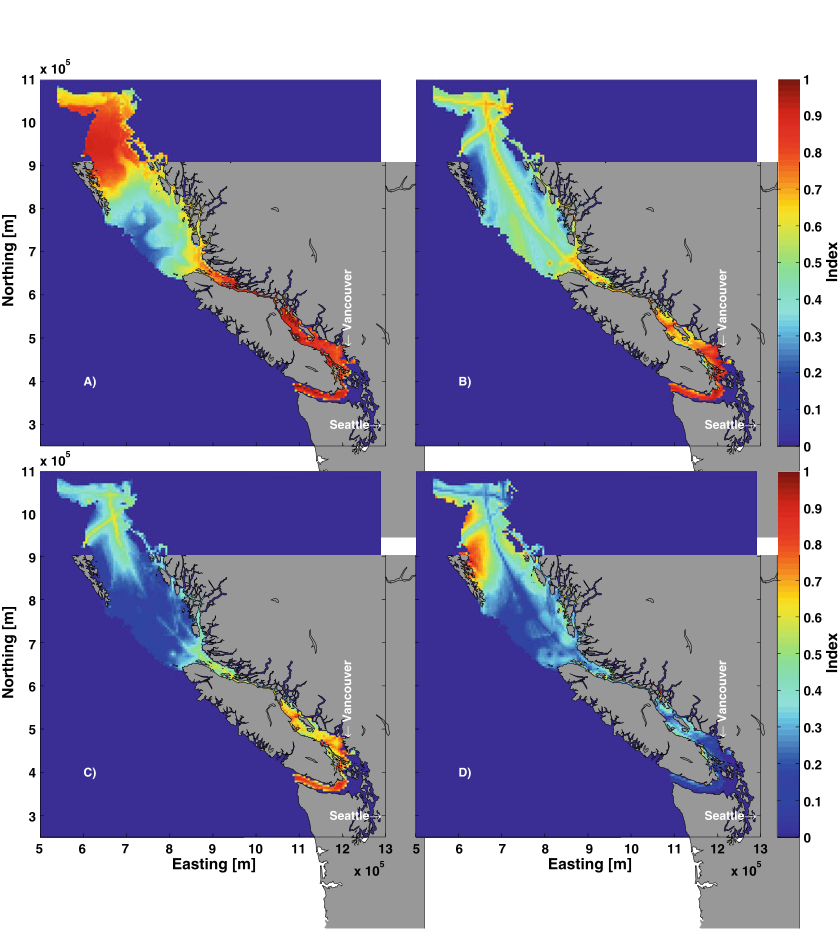
Fig. 7.30 Maps of (a) harbor porpoise (Phocoena phocoena) density, (b) audiogram-weighted ship noise, (c) areas of risk (i.e., high animal density and high noise), and (d) areas of opportunity (i.e., high animal density and low noise) in British Columbia, Canada. # Williams et al. 2015; https://doi.org/10.1016/j. marpolbul.2015.09.012. Licensed under CC BY-NC-ND 4.0; https://creativecommons.org/licenses/by-nc-nd/4.0/
Notes
Files
figure.png
Files
(363.0 kB)
| Name | Size | Download all |
|---|---|---|
|
md5:37d5a44bd8cf06b0e4cebcd4667bc878
|
363.0 kB | Preview Download |
Linked records
Additional details
Related works
- Is part of
- Book chapter: 10.1007/978-3-030-97540-1_7 (DOI)
- Book chapter: urn:lsid:plazi.org:pub:510AFFBCD00BFFF8C31D624BFF93FF8D (LSID)
- Book chapter: https://zenodo.org/record/10475618 (URL)