Ecological and Morphological Correlates of Acuity in Birds

- 1. University of California, Santa Barbara
- 2. Purdue University
- 3. University of Exeter
Description
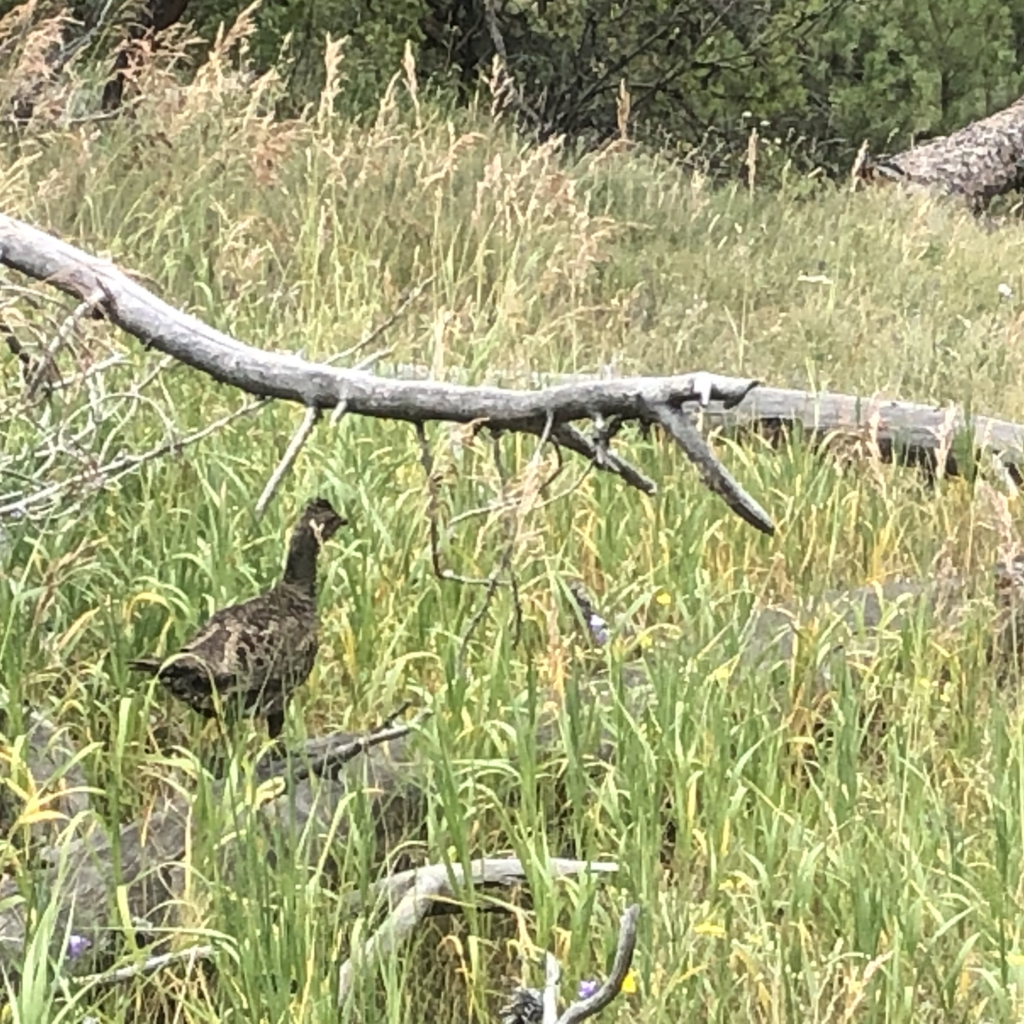
Birds use their visual systems for a variety of important tasks, such as foraging and predator detection, that require them to resolve an image. However, visual acuity (the ability to perceive spatial detail) varies by two orders of magnitude across birds. Prior studies indicate that eye size and aspects of a species' ecology may drive variation in acuity, but these studies have been restricted to small numbers of species. We used a literature review to gather data on acuity measured either behaviorally or anatomically for 94 species from 38 families. We then examined how acuity varies in relation to (1) eye size, (2) habitat spatial complexity, (3) habitat light level, (4) diet composition, (5) prey mobility, and (6) foraging mode. A phylogenetically-controlled model including all of the above factors as predictors indicated that eye size, habitat spatial complexity, light level, and diet composition are significant predictors of acuity. Examining each ecological variable in turn revealed that acuity is lower in species that inhabit spatially complex, vegetative habitats, and higher in species whose diet comprises vertebrates or scavenged food. Together, our results suggest that the need to detect important objects from far away—such as predators for species that live in open habitats, and food items for species that forage on vertebrate and scavenged prey—has likely been a key driver of higher acuity in some species, helping to elucidate how visual capabilities may be adapted to an animal's visual needs.
Notes
Methods
We provide a brief description of methods here; refer to the published manuscript for more details.
Comparative database of acuity
We assembled a database of visual acuity in birds using published data; for each species, we recorded the highest reported acuity value. We then restricted the database to include only data measured using behavioral assays or anatomical methods (specifically the density of retinal ganglion cells, RGCs).
To determine whether it would be appropriate to combine acuity data derived from RGCs and behavioral assays for analyses, we performed two analyses. First, we compiled measures of acuity in 28 vertebrate species with camera eyes (the type of eye found in birds) in which acuity has been measured using both methods (Table S2). We found that behaviorally-derived and RGC-derived acuity measures from the same species are highly correlated (p<0.0001; Figure S1) in a phylogenetically-corrected model using a tree from timetree.org. However, this analysis included only five species of birds; thus, to address this issue in a larger dataset of bird acuities, we created a PGLS regression in which acuity was the response variable and eye size and method of acuity measurement, and their interaction, were predictors. A phylogenetic ANCOVA (see below for details on the phylogenetic tree used) showed that, because the interaction term between eye size and method of measurement was not significant (p=0.39), the slope of the regression line between acuity and eye size is similar for both methods of measurement. Thus, we concluded that it was appropriate to include both RGC-derived and behaviorally-derived measures of acuity in our database for analyses.
For five species, the database included acuity estimates from both behavioral assays and RGC density (with the average difference between the behaviorally- and RGC-derived estimates being only 0.84 cpd). Given the very small differences in acuity from the two methods, and the analyses above regarding combining behavioral and RGC data together, we preferentially used estimates from RGC density in analyses if both behavioral and RGC-based measures of acuity existed. If multiple studies had used the same method to measure acuity in a given species, we used the acuity estimate from the most recent study. Species were only included in the database for analysis if we could locate both eye axial diameter and body mass data for that species (see below), resulting in a sample size of 93 species for analysis (Table S1).
Here, we refer to acuity throughout in units of cycles per degree (cpd), which is the number of pairs of black and white stripes an organism can discriminate within a single degree of visual angle. Higher values in cpd indicate ability to resolve finer spatial details, and thus higher acuity. In some of the original literature we surveyed, acuity was reported in alternative units (such as minutes of arc or degrees); prior to inclusion in our database, we translated these values to cpd.
Phylogenetic relatedness and Phylogenetic Signal (λ)
To account for phylogenetic relatedness between species, we used a published phylogeny. The published tree was trimmed to include only the 93 species in our acuity database, maintaining branch length information in our sub-tree. The degree of phylogenetic signal in acuity was estimated by calculating Pagel's λ.
Eye size and body mass
Where possible, we recorded eye axial length (hereafter 'eye size') in our database as reported in the original citation; this yielded data on eye size in 73 species. For the remainder, we located published eye size values from a variety of sources (see Table S1), to maximize the number of species for which we had analyzable data. To obtain comparable body mass data for all of the species in our database, we used values from the CRC Handbook of Avian Body Masses.
Classifying Species According to Ecology
We examined the relationship between visual acuity and several aspects of a species' ecology. Given that many bird species can inhabit a wide array of habitat types, or make use of a diversity of food sources, it can be complex to categorize birds by factors like diet and habitat; thus, our categories were relatively broad.
Habitat
We examined how acuity relates to two aspects of habitat: spatial complexity and light level.
Diet and Foraging
To understand how acuity relates to diet, species were also classified by whether their primary prey type was mobile or immobile prey. Mobile prey included vertebrates and invertebrates (outside of scavenging); immobile prey included plant matter of all kinds, such as fruits, seeds, nectar, flowers, and fruits, as well as scavenged prey.
Lastly, we classified species by foraging mode. Specifically, species were classified as using foraging modes that involve resolving and targeting prey from a distance (far-sighted) versus from close up (near-sighted) foraging maneuvers.
Files
Behav_and_RGC_Data.csv
Files
(9.5 MB)
| Name | Size | Download all |
|---|---|---|
|
md5:57dbdcbe1fa6930f263311b9e200ad49
|
1.5 kB | Preview Download |
|
md5:fd61396ac1da3015169bd5023c251032
|
18.4 kB | Preview Download |
|
md5:17e691ad5b9249d87cc530c721a12338
|
3.1 MB | Download |
|
md5:793892b2a2c36c2b928f9cceb1978a24
|
3.1 MB | Download |
|
md5:4b5521e6fae84f277a8446b602ea24d8
|
3.1 MB | Download |
|
md5:fe5102ae215ec613ffa3cd8e0e6fb5b9
|
3.6 kB | Preview Download |
|
md5:ffb0049d55760498a7cc31bd18779a64
|
3.6 kB | Download |
|
md5:3760d30266683c4a72b7aad11a12ccfe
|
4.2 kB | Preview Download |
|
md5:e4bc9dd3c5ef33b8aede4d40f627e25b
|
1.3 kB | Download |
Additional details
Related works
- Is derived from
- 10.5281/zenodo.8231234 (DOI)