Published May 11, 2019
| Version v1
Figure
Open
FIGURE 3 in Inferring global species richness from megatransect data and undetected species estimates
Creators
Description
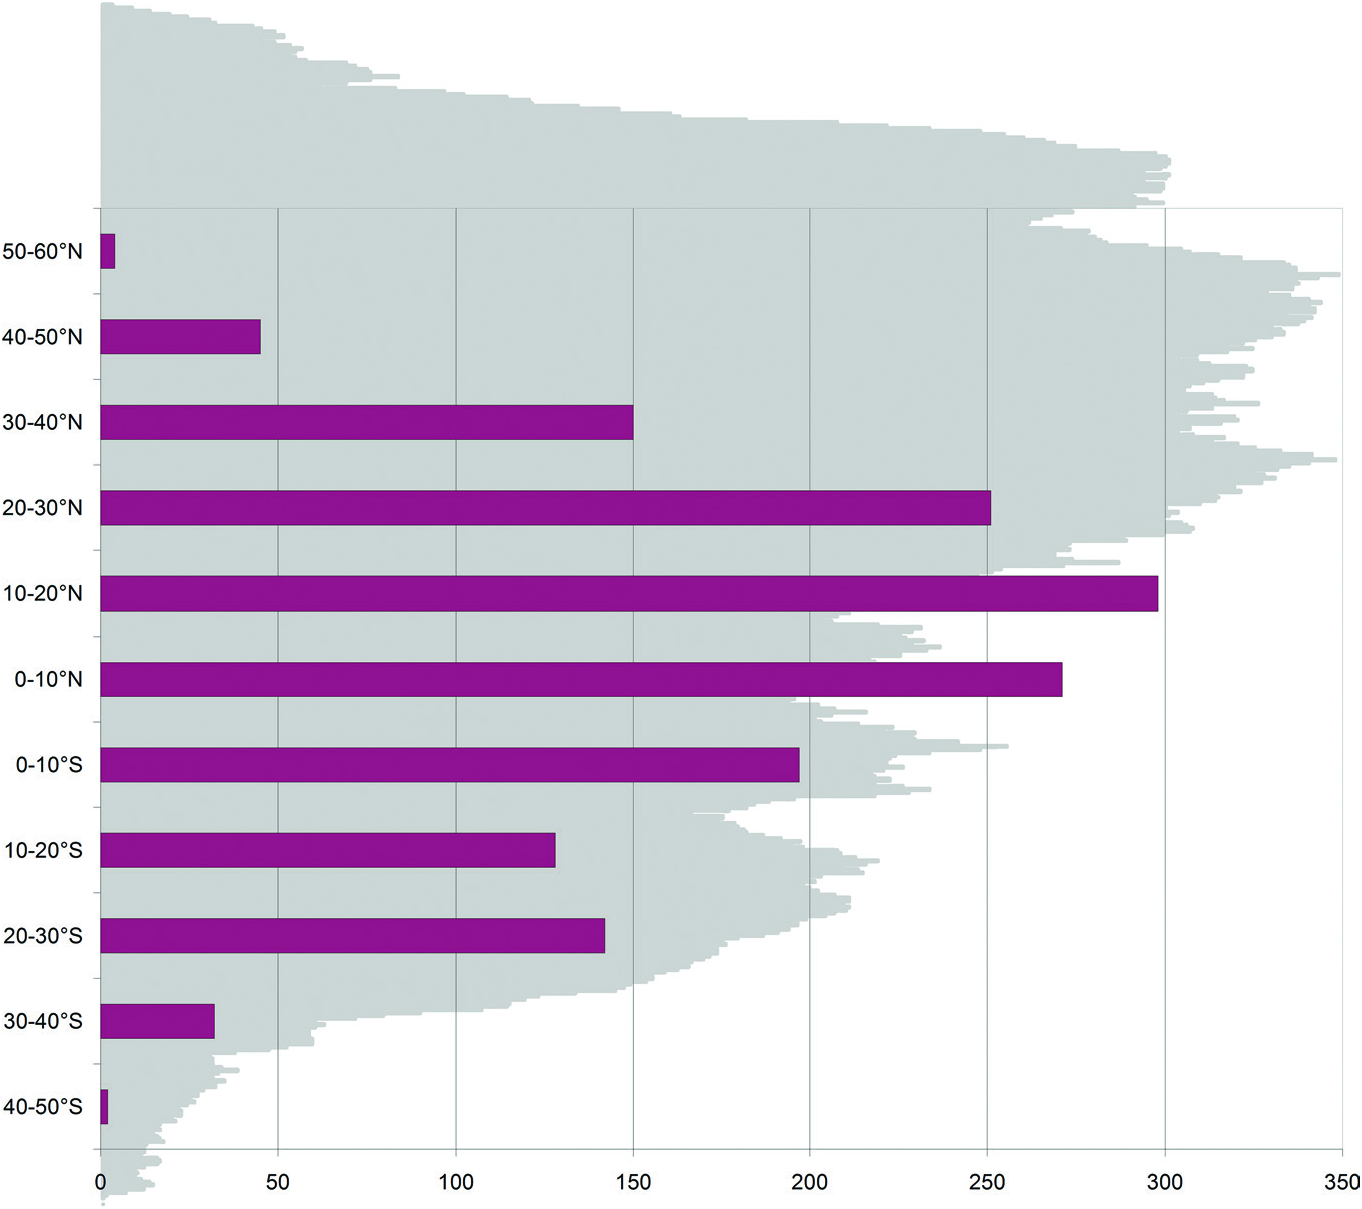
FIGURE 3 Latitudinal distribution of currently valid species of Pholcidae. Numbers of Pholci- dae species (x-axis) known from different latitudes (y-axis; N, north; S, south), with the land mass distribution shown in grey (from www.ecoclimax.com; excluding Antarctica). Pholcidae species richness is slightly shifted towards the north, possibly as a result of the unbalanced land masses and/or taxonomists' biases, but most diversity is in tropical regions.
Notes
Files
figure.png
Files
(275.0 kB)
| Name | Size | Download all |
|---|---|---|
|
md5:53602269d3b795e5625bad2c5851718c
|
275.0 kB | Preview Download |
Linked records
Additional details
Related works
- Is part of
- Journal article: 10.1163/18759866-20191347 (DOI)
- Journal article: urn:lsid:plazi.org:pub:FFD5FF97FFA04656555FFFFA2110B21E (LSID)
- Journal article: https://zenodo.org/record/8355681 (URL)