Published August 31, 2020
| Version v1
Figure
Open
Fig. 1 in Assessment of metabolic variability and diversity present in leaf, peel and pulp tissue of diploid and triploid Musa spp.
- 1. ∗ & School of Biological Sciences, Royal Holloway, University of London, Egham Hill, Egham, Surrey, TW20 0EX, UK
Description
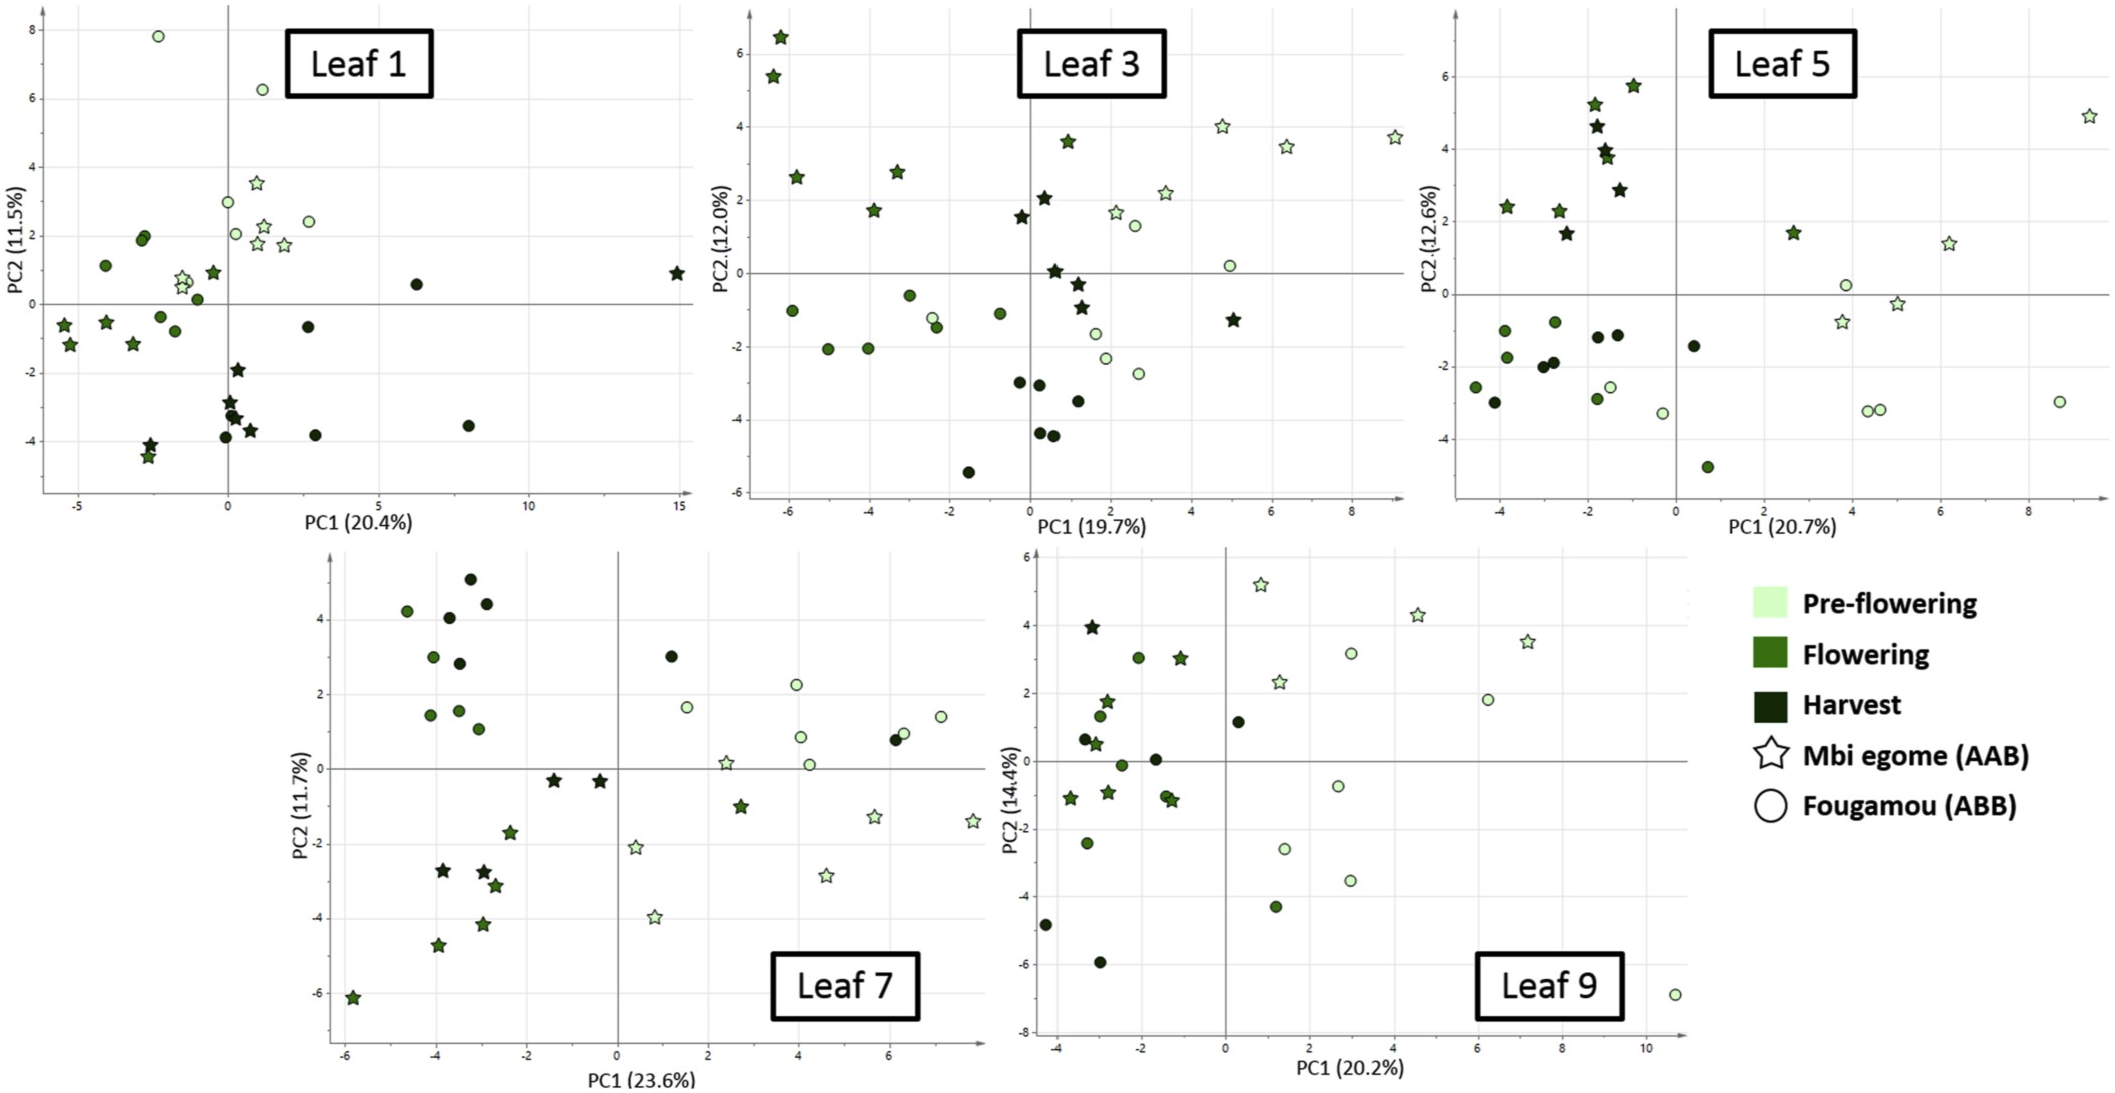
Fig. 1. PCA analysis of leaf 1 to 9 comparing Mbi egome (stars) and Fougamou (circles) at three plant growth stages. The three plant growth stages comprised preflowering, flowering and harvest stage (colours displayed in legend). Data includes 76 metabolites analysed by UPLC-DAD and GC-MS (polar extracts). (For interpretation of the references to colour in this figure legend, the reader is referred to the Web version of this article.)
Notes
Files
figure.png
Files
(535.1 kB)
| Name | Size | Download all |
|---|---|---|
|
md5:d04d1f49b63621b2dcafba8062f69a9b
|
535.1 kB | Preview Download |
Linked records
Additional details
Related works
- Is part of
- Journal article: 10.1016/j.phytochem.2020.112388 (DOI)
- Journal article: urn:lsid:plazi.org:pub:FFC7FFEA2B03FFB2FFAFC95BC124FB7A (LSID)
- Journal article: https://zenodo.org/record/8295701 (URL)