Optimization Framework for Temporal Interference Current Tibial Nerve Stimulation in Tibial Nerves based on In-Silico Studies
Authors/Creators
- 1. Department of Convergence IT Engineering, Pohang University of Science and Technology (POSTECH), Po-hang, Republic of Korea
- 2. Biomedical Engineering Research Center, Samsung Medical Center, Seoul 06351, South Korea Department of Medical Device Management and Research, SAIHST, Sungkyunkwan University, Seoul 06351, South Korea
- 3. Department of Medical Device Management and Research, SAIHST, Sungkyunkwan University, Seoul 06351, South Korea Department of Radiology, Samsung Medical Center, Sungkyunkwan University school of Medicine, Seoul 06351, South Korea
- 4. Department of Medical Device Management and Research, SAIHST, Sungkyunkwan University, Seoul 06351, South Korea Department of Urology, Samsung Medical Center, Sungkyunkwan University school of Medicine, Seoul 06351, South Korea
- 5. Department of Convergence IT Engineering, Pohang University of Science and Technology (POSTECH), Po-hang, Republic of Korea Department of Electrical Engineering, Pohang University of Science and Technology (POSTECH), Pohang, Republic of Korea Department of Mechanical Engineering, Pohang University of Science and Technology (POSTECH), Pohang, Republic of Korea Institute of Convergence Science, Yonsei University, Seoul, Republic of Korea
Description
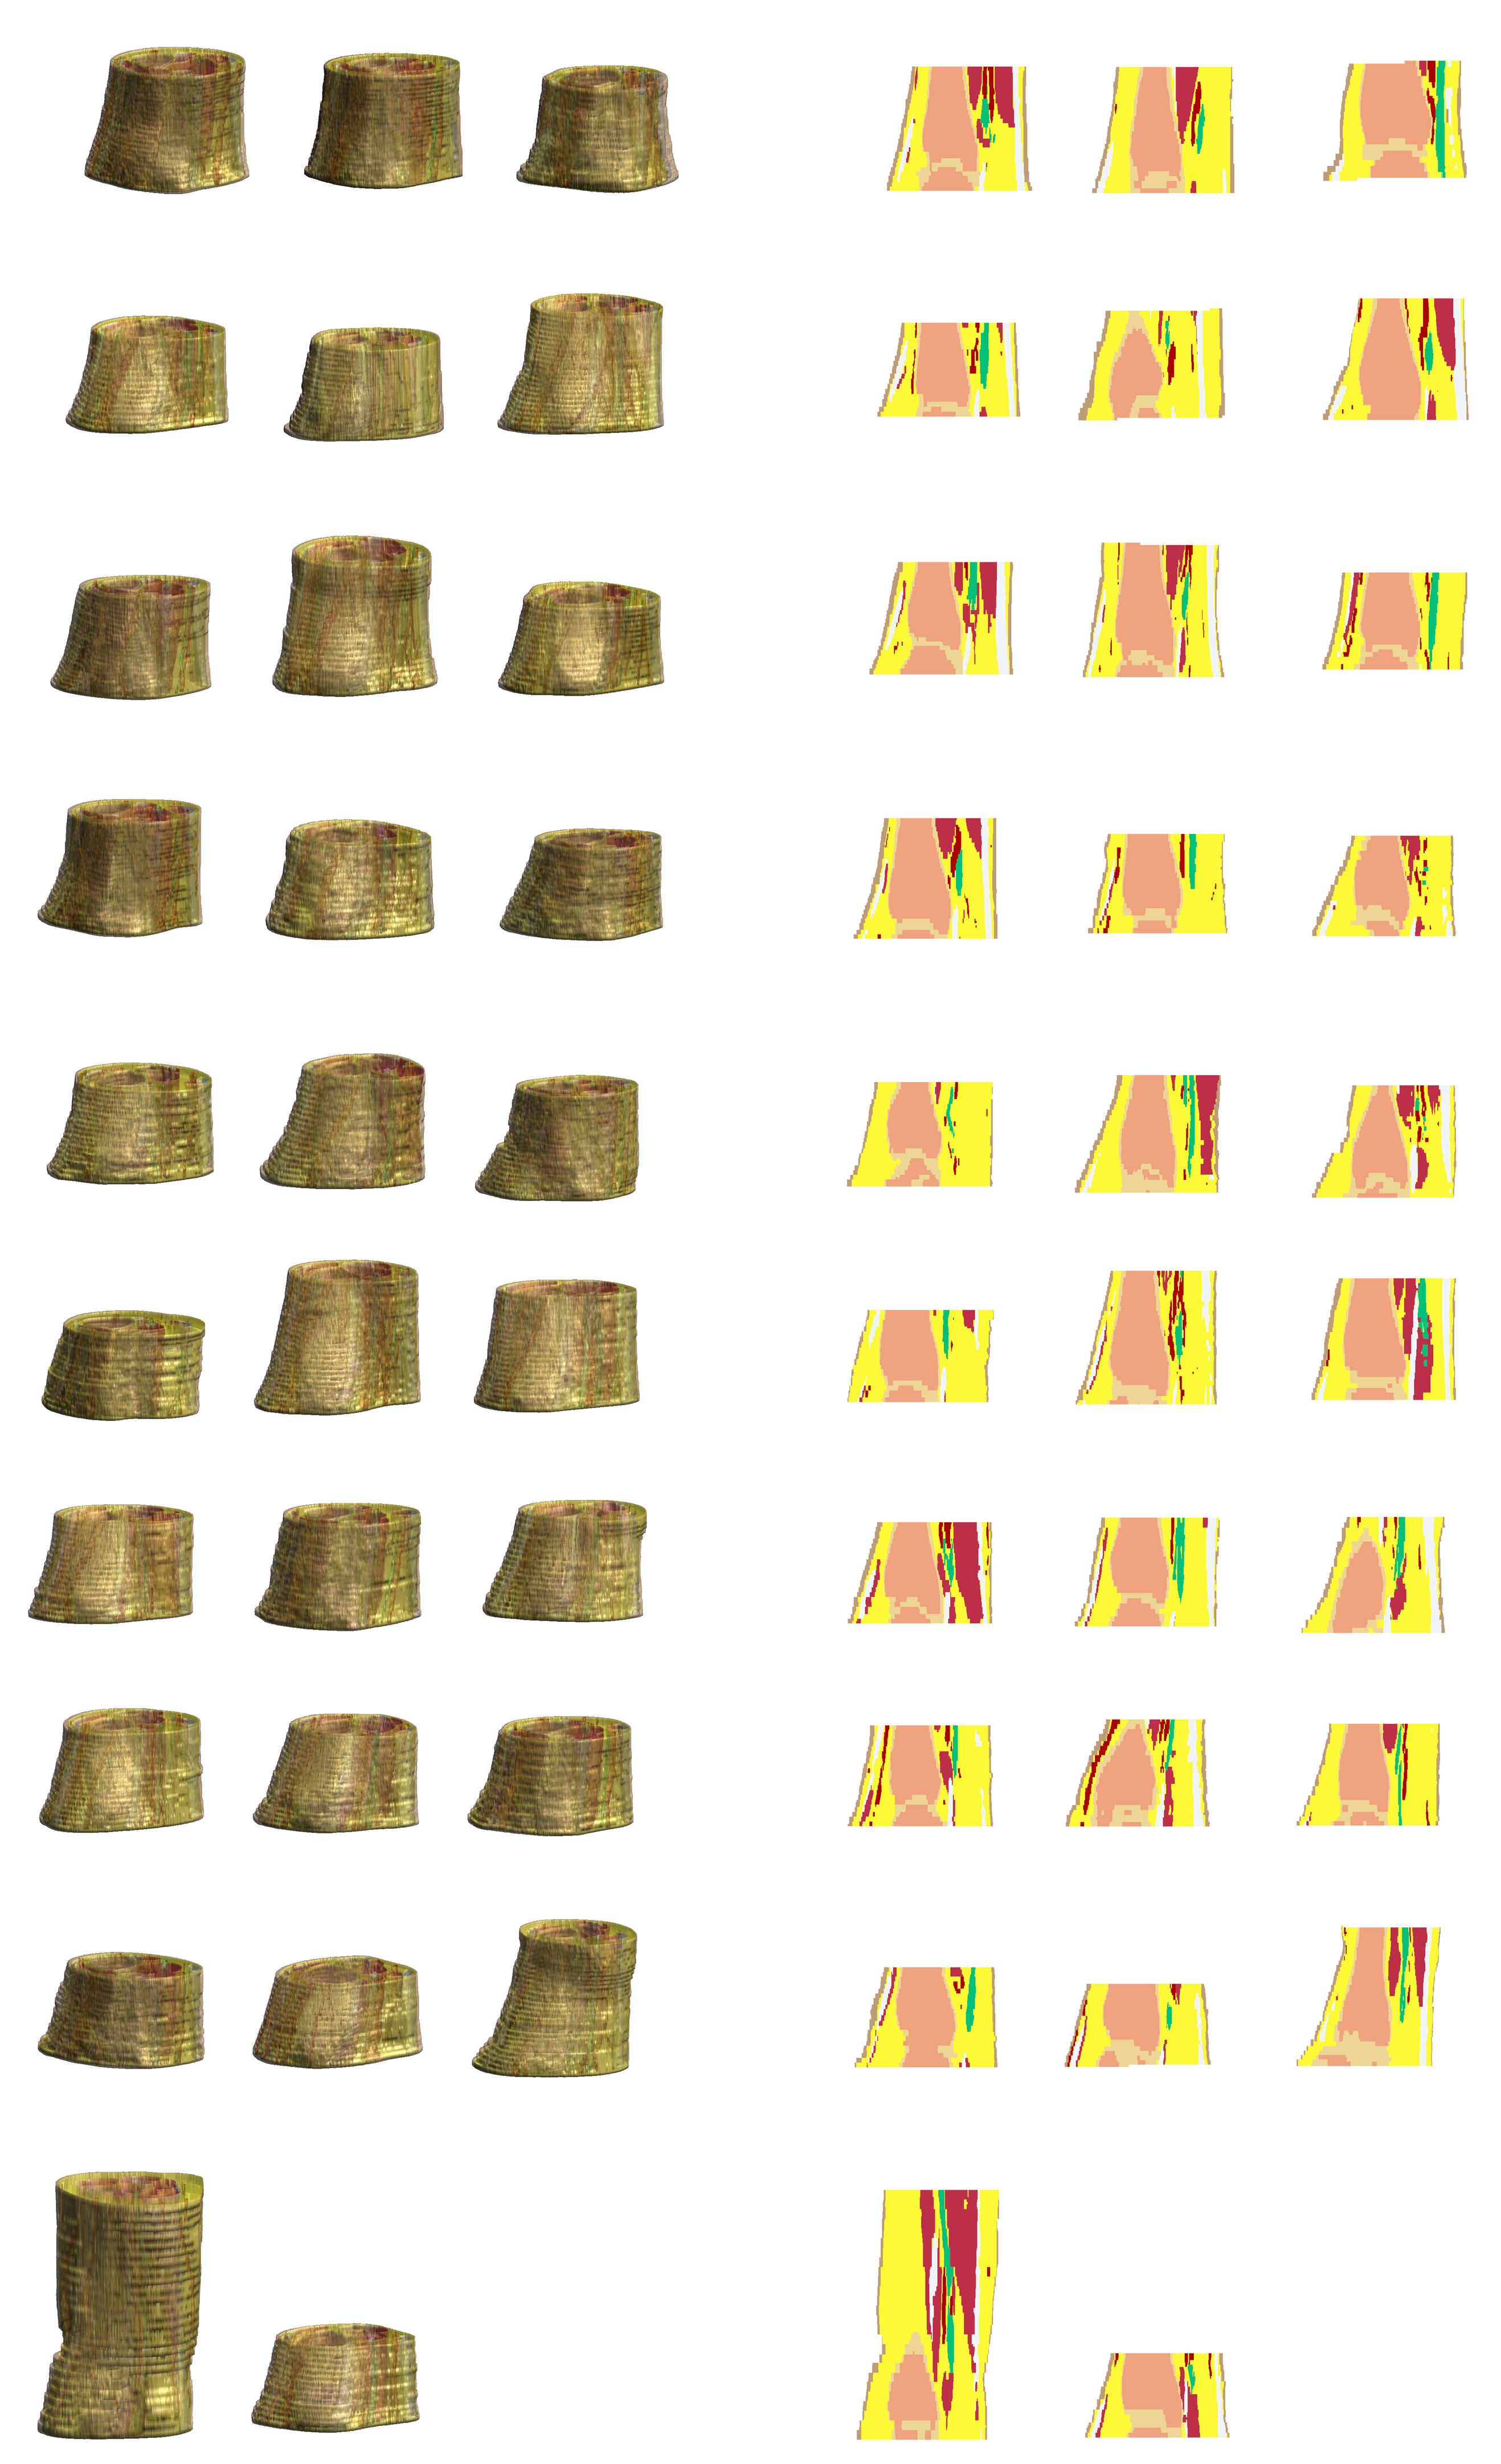
Online Resource 1: All MR-based 3D models and cross-sections. n = 29.
Online Resource 2: Comparison of changes in electrode pairs according to anatomical differences (independent sample t-test for Online Resource 2, *p<0.0001)
When Electrode opt TI was applied, the model in which the combination of electrodes was changed relative to Parallel opt TI was referred to as the Change group, and the model that was unaltered was called the Non-change group. In the case of the Change group, PR values increased in Electrode opt compared with those in the Parallel opt group. When comparing the ratio of nerve depth to the total length of the model section, we confirmed the Change group exhibited a smaller ratio. Since the sample size of each group was different, the difference of average in the PR value of each group was evaluated using an independent sample t-test. Purple dots present raw data. Mean and standard deviation of the changes are shown in black.
Files
Online Resource 1.png
Files
(4.1 MB)
| Name | Size | Download all |
|---|---|---|
|
md5:822ce12b601005aec818421ddf7783eb
|
3.9 MB | Preview Download |
|
md5:e508b7b8563ce2116902dcc447de0b08
|
139.9 kB | Preview Download |