Spectral reflectance data of Mercury's surface collected by the Mercury Atmospheric and Surface Composition Spectrometer (MASCS) instrument during orbital observations of the NASA MESSENGER mission between 2011 and 2015 resampled to a [55399 × 396] tabular data format.

Description
MASCS is a three sensor point spectrometer with a spectral coverage from 200 nm to 1450 nm.
Single spectra are resamples in to steps to a format useful for our ML application : a datacube with ~400 spectral channel covering the whole surface of Mercury.
The final dataset has dimension [N×M] where N is the number of grid cells (360 × 180 = 64, 800) and M is the number of spectral features (396).
Due to the incomplete coverage and data filtering, some grid cells are empty.
After removing these empty cells, the size of the dataset is [55399 × 396].
This specific product is stored as a gzip compressed json, where each element is a grid cell.
We are in the process to publish a complete pipeline to produce this product from RAW data on https://github.com/epn-ml/MESSENGER-Mercury-Surface-Cassification-Unsupervised_DLR/ .
Spectral reflectance data of Mercury’s surface collected by the Mercury Atmospheric and Surface Composition Spectrometer (MASCS) instrument during orbital observations of the NASA MESSENGER mission between 2011 and 2015.
MASCS is a three sensor point spectrometer with a spectral coverage from 200 nm to 1450 nm.
Single spectra are resamples in to steps to a format useful for our ML application : a datacube with ~400 spectral channel covering the whole surface of Mercury.
The final dataset has dimension [N×M] where N is the number of grid cells (360 × 180 = 64, 800) and M is the number of spectral features (396).
Due to the incomplete coverage and data filtering, some grid cells are empty.
After removing these empty cells, the size of the dataset is [55399 × 396].
0. Pre-filtering
We used the most recent dataset that had large-scale photometric corrections and thus was almost free from observation geometry effects.
However, extreme geometry are still present and are typically associated with high noise and some residual instrumental effects.
Based on our empirical tests, we filtered out observations with an emission/incidence angle ≥80∘.
We also calculated the median value per wavelength and per cell grid when constructing the global hyperspectral data cube and filtered out observations falling under the 2nd percentile and above 99.9th percentile to clean some residual geometry effects.
With this approach we create an effective noise filter while retaining enough observations to be able to analyse the entirety of the surface of the planet.
1. Spectral resmpling
Unprocessed MASCS spectra could have 512 or 256 channes, depending on binning.
We resampled the data in the spectral dimension to a common wavelength range from 260 nm to 1052 nm with a 4 nm resolution (2 nm spectral sampling), resulting in 396 spectral channels.
This approach slightly oversamples the original 4.77 nm spectral resolution and removes some points from the original 200-1050 nm range.
The resulting data matrix is expressed in tabular form, with each row representing a single grid cell or pixel on the surface.
The elements of each row are the spectral reflectance values from the VIS instrument at 396 (resampled) wavelengths.
2. Spatial resmpling
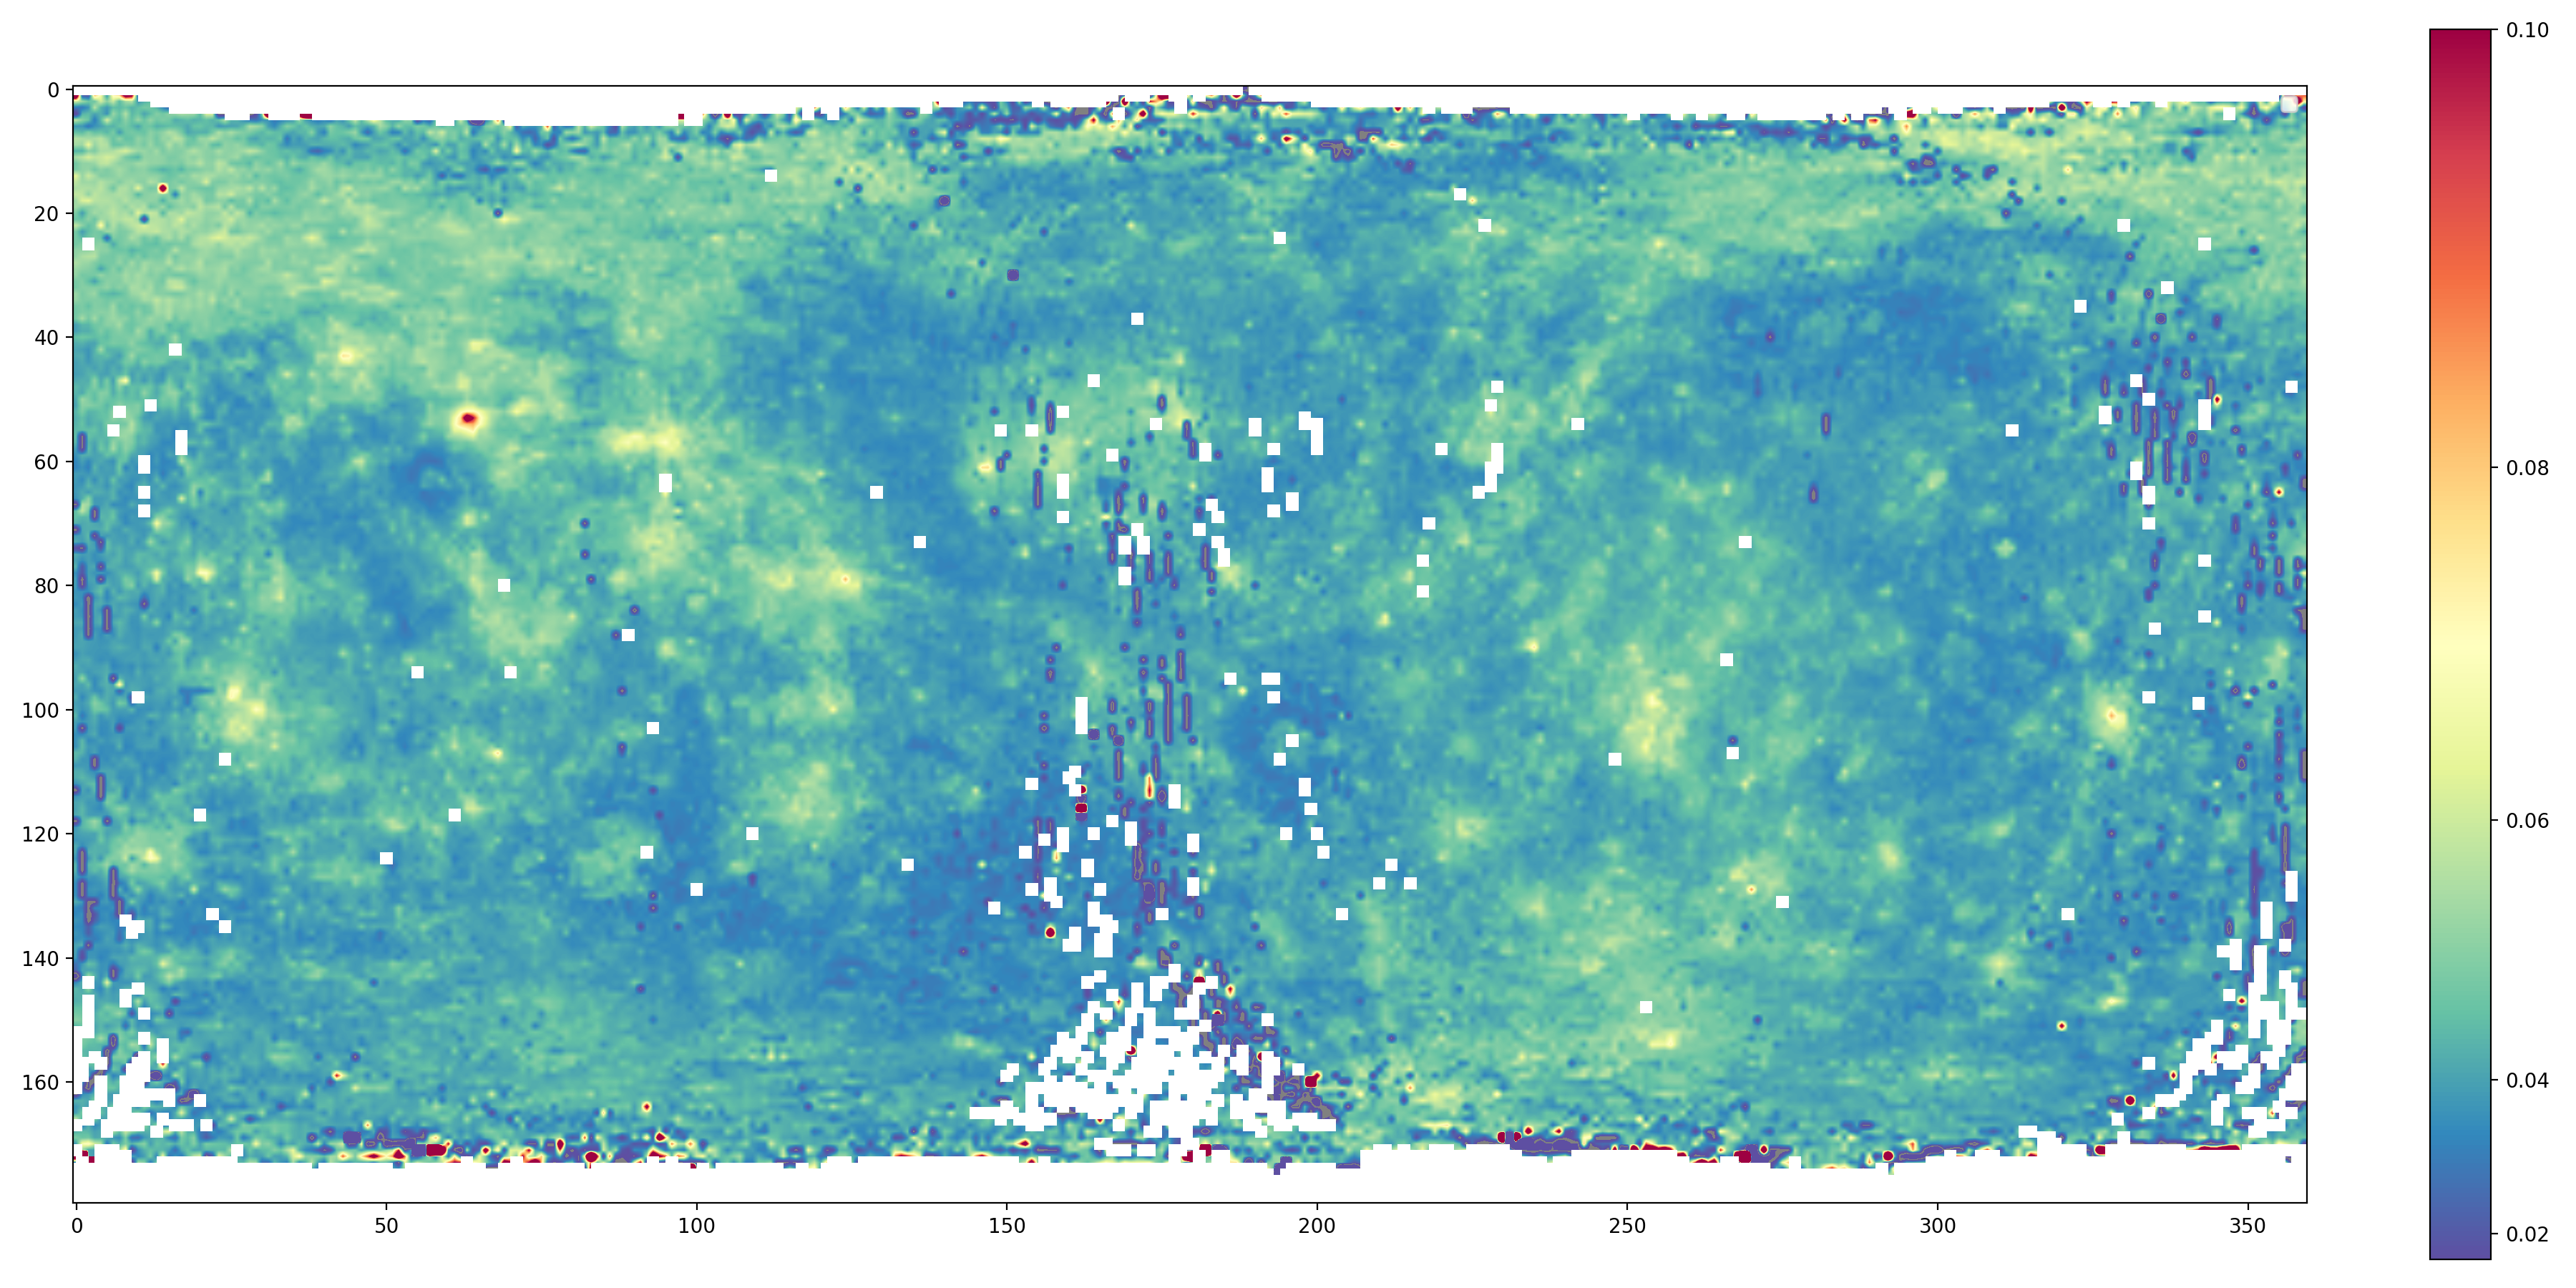
The whole dataset of ∼ 5 million spectra is resampled to a planet-wide rectangular grid of 1×1deg in the latitudinal band between ± 80.
The cell longitudinal size varies between ∼ 40 km at the equator to a minimum of ∼ 10 km at ±80∘.
Thus, the area spanned by each grid cell depends on the latitude. However, the same is true for the acquisition process, where higher spatial resolution is reached near the equator and lower resolution at the poles.
Files
grid_2D_0_360_-90_+90_1deg_st_median_photom_iof_sp_2nm.png
Files
(199.7 MB)
| Name | Size | Download all |
|---|---|---|
|
md5:ef886101f3f08eba8fe9aa9a5aa48268
|
197.1 MB | Download |
|
md5:04f54e31cf7508220120b4e5c25dd278
|
2.6 MB | Preview Download |
Additional details
References
- D'Amore, M., & Padovan, S. (2022). Automated surface mapping via unsupervised learning and classification of Mercury Visible–Near-Infrared reflectance spectra. In Machine Learning for Planetary Science (pp. 131–149). Elsevier.