Forestry roads in the Purapel fluvial catchment and related changes in sediment connectivity

- 1. Universidad de La Frontera
- 2. Universidad de Chile
- 3. Universidad Austral de Chile
Description
This dataset contains georeferenced data of forestry roads and sediment connectivity in the Purapel catchment, which drains the Chilean Coastal Range. The forestry road network consists of all the dirt and gravel roads mapped in QGIS by observing open satellite images and vectorial data available during January 2021. The observed data are maps that were listed in the QGIS OpenLayers plugin (https://github.com/sourcepole/qgis-openlayers-plugin), such as Google Satellite (Map data ©2015 Google) and OpenStreetMap 1, the road network of the Chilean Congress National Library (https://www.bcn.cl/siit/mapas_vectoriales) and compositions of Sentinel 2 images (European Space Agency, courtesy of the U.S. Geological Survey) of the post-2017 fire period.
Sediment Connectivity maps were calculated on a 5 m resolution LiDAR DTM using the Connectivity Index 2. The maps were derived from the stand-alone, free and open-source executable SedInConnect 2.3 3 using the Weighting factor of 2 and two different targets, which are available as tif files:
- ICs.tif contains ICs, the Connectivity Index to the stream network.
- ICrs.tif contains ICrs, the Connectivity Index to the road and the stream network.
Here, the Road Connectivity, RC (dimensionless) is defined as the difference between both previous maps, with the aim to describe the change in sediment connectivity due to forestry road network:
- RC = ICrs - ICs
It is available as RC.tif file. The area of high RC was defined using the percentile 95 (3.12). File RC95.tif is a mask of RC ≥ 3.12.
The contributing area CA (m2) was calculated using the multiple flow D-infinity approach 4 using TauDEM (https://hydrology.usu.edu/taudem/taudem5/downloads.html).
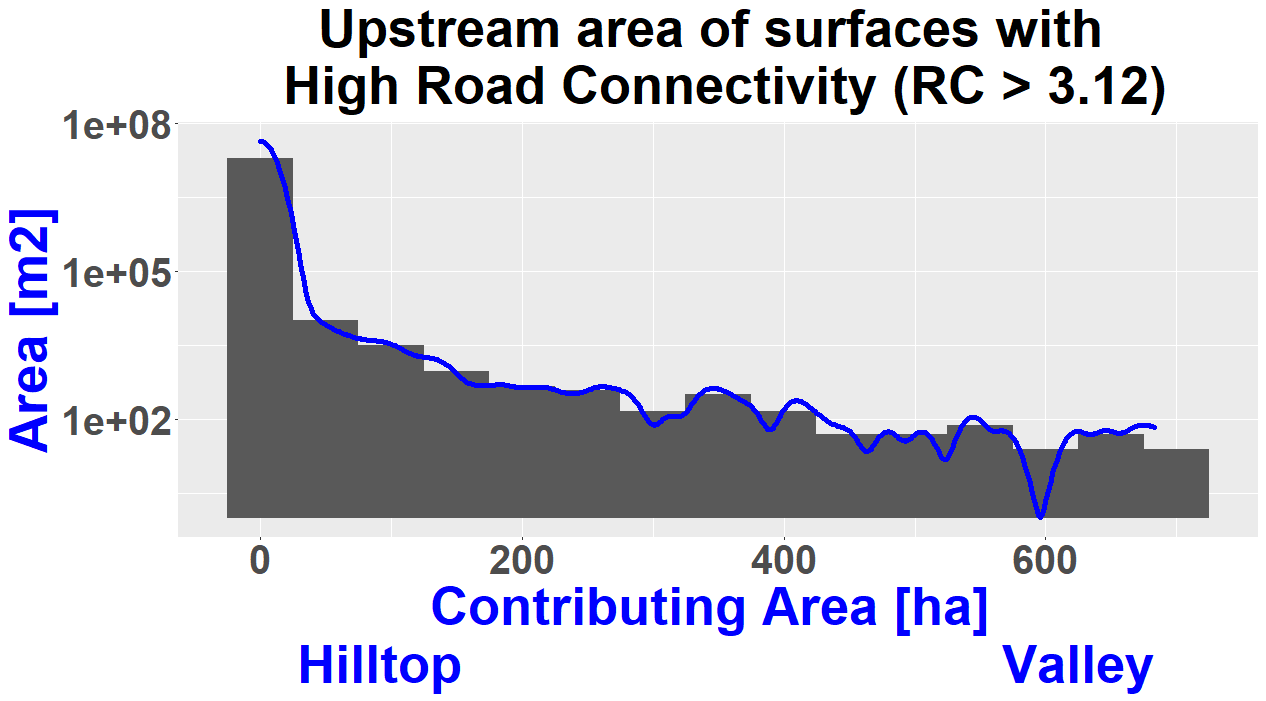
The file CA_RC95.tif contains the contributing area (m2) of the surfaces with highest changes in sediment connectivity due to the road network. That is:
- CA_RC95 = {CA | RC ≥ 3.12}
The landscape distribution of those surfaces, in terms of proximity to the hilltops and valleys, is described by the density plot of the raster file CA_RC95.tif in R:
library("raster")
library("ggplot2")

CA_RC95<-raster("CA_RC95.tif")
CA_RC95<-CA_RC95*0.0025

df = as.data.frame(CA_RC95)
df = na.omit(df)

ggplot(df,aes(CA_RC95)) +
  geom_histogram(aes(y=..count..*25),binwidth = 50)+
  geom_density(aes(y=50 * ..count..*25), col="blue",size=2, adjust=10000)+
  xlab("Contributing Area [ha] \n Hilltop                                    Valley") + ylab("Area [m2]")+
  theme(axis.text.x = element_text(face="bold", size=30),
        plot.title = element_text(color="black", size=40, face="bold",hjust=0.5),
        axis.title.x=element_text(color="blue", size=40, face="bold"),
        axis.text.y = element_text(face="bold",  size=30),
        axis.title.y=element_text(color="blue", size=40, face="bold"))+ scale_y_continuous(trans = 'log10')+
  ggtitle("Upstream area of surfaces with \n High Road Connectivity (RC > 3.12)")
Bibliography
1. OpenStreetMap contributors. Planet dump retrieved from https://planet.osm.org. https://www.openstreetmap.org/ (2017).
2. Cavalli, M., Trevisani, S., Comiti, F. & Marchi, L. Geomorphometric assessment of spatial sediment connectivity in small Alpine catchments. Geomorphology 188, 31–41 (2013).
3. Crema, S. & Cavalli, M. SedInConnect: a stand-alone, free and open source tool for the assessment of sediment connectivity. Computers and Geosciences 111, 39–45 (2018).
4. Tarboton, D. G. A new method for the determination of flow directions and upslope areas in grid digital elevation models. Water Resources Research 33, 309–319 (1997).
Notes
Files
CA_RC95.tif
Files
(641.6 MB)
| Name | Size | Download all |
|---|---|---|
|
md5:e5f4fef6343a3f2278bb5ef222257ee7
|
150.3 MB | Preview Download |
|
md5:6b6346fa40a2d62a5885526e2a1042c9
|
662.9 kB | Download |
|
md5:a5661825fdade2abc15482d0455cd852
|
409 Bytes | Download |
|
md5:95412465bda15121a0b3f5462e248c7b
|
2.0 MB | Download |
|
md5:12ff691336b1ce6df3a014e5d659650b
|
8.1 kB | Preview Download |
|
md5:4a9955107ae0bea4d664174a8b72f95c
|
42.2 kB | Download |
|
md5:68e05bd0aac841a495cf25e5c8eaa980
|
150.3 MB | Preview Download |
|
md5:848cc56ba41fe6cb1ff07035c2598f34
|
150.3 MB | Preview Download |
|
md5:ca72fcfddfb4a35bbc78f43e381c4352
|
150.3 MB | Preview Download |
|
md5:5f517f15af69d5eba1e003e9923eca38
|
37.6 MB | Preview Download |
|
md5:64df769bf6a38f66384475c785bee7b2
|
24.4 kB | Preview Download |
Additional details
Related works
- Is supplement to
- Preprint: 10.1002/essoar.10512068.1 (DOI)
References
- OpenStreetMap contributors. Planet dump retrieved from https://planet.osm.org. https://www.openstreetmap.org/ (2017).
- Cavalli, M., Trevisani, S., Comiti, F. & Marchi, L. Geomorphometric assessment of spatial sediment connectivity in small Alpine catchments. Geomorphology 188, 31–41 (2013).
- Crema, S. & Cavalli, M. SedInConnect: a stand-alone, free and open source tool for the assessment of sediment connectivity. Computers and Geosciences 111, 39–45 (2018).
- Tarboton, D. G. A new method for the determination of flow directions and upslope areas in grid digital elevation models. Water Resources Research 33, 309–319 (1997).