Data from: Pyrogeography across the western Palearctic: A diversity of fire regimes

Description
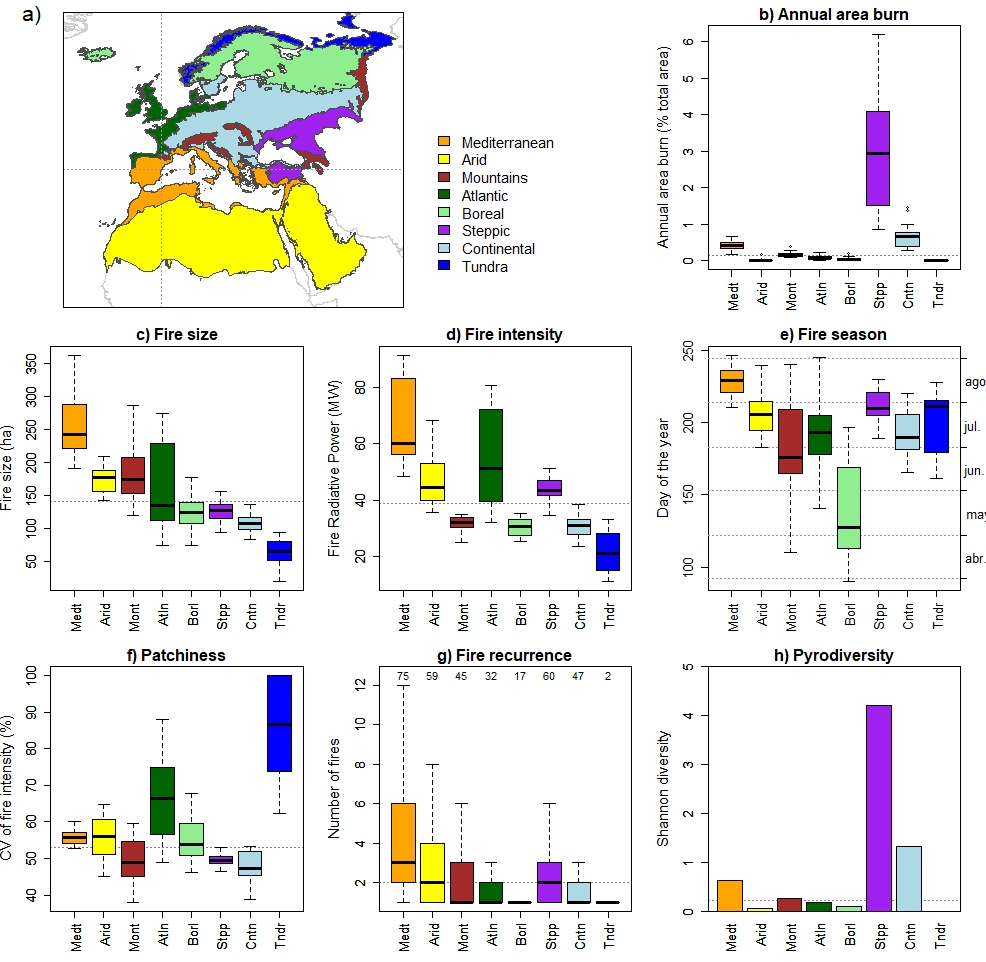
We characterised fire regimes and estimated fire regime parameters (area burnt, size, intensity, season, patchiness, pyrodiversity) at broad spatial scales using remotely sensed individual-fire data. Specifically, we focused on the western part of the Palearctic realm, i.e., Europe, North Africa, and the Near East. We first divided the study area into eight large ecoregions based on their environment and vegetation (ecoregions): Mediterranean, Arid, Atlantic, Mountains, Boreal, Steppes, Continental, and Tundra. Then we intersected each ecoregion with individual-fire data obtained from remote sensing hotspots to estimate fire regime parameters for each environment. This allowed us to compute annual area burnt, fire size, fire intensity, fire season, fire patchiness, fire recurrence, and pyrodiversity for each ecoregion. We then related those fire parameters with the ecoregions' climate and analysed the temporal trends in fire size. The results suggest that fire regime parameters vary across different environments (ecoregions). The Mediterranean had the largest, most intense, and most recurrent fires, but the Steppes had the largest burnt area. Arid ecosystems had the most extended fire season, Tundra had the patchiest fires, and Boreal forests had the earliest fires of the year. The spatial variability in fire regimes was largely explained by the variability of climate and vegetation, with a tendency for greater fire activity in the warmer ecoregions. There was also a temporal tendency for fires to become larger during the last two decades, especially in Arid and Continental environments. In conclusion, fire regime characteristics of each ecoregion are unique, with a tendency for greater fire activity in warmer environments, and for increasingly large fires in recent decades.
Notes
Files
Fig1_map_stats.jpeg
Additional details
Related works
- Is derived from
- 10.5061/dryad.k98sf7m8c (DOI)