Map of the dominant mineralogy over and around the Mars2020 landing ellipse with correspondent spectral signatures
Creators
- 1. University of Massachusetts Amherst
- 2. Jet Propulsion Lab, California Institute of Technology
- 3. Johns Hopkins Applied Physics Lab
- 4. Brown University
Description
This map of the dominant mineralogy over and around the Mars 2020 landing ellipse at Jezero crater was created from CRISM L detector observations HRL000040FF, FRT000047A3, FRT0005C5E, and FRS00031442. Each individual raw cube underwent combined atmospheric compensation and denoising according to the method described in (Itoh and Parente, 2021). Then the GAN-based method, described in (Saranathan and Parente, 2021), was employed to obtain a mineral map for each observation. The final mosaic was obtained by coregistering the individual maps to the USGS Mars 2020 Jezero Crater Landing Site Controlled CTX and HiRISE DEM available at https://astrogeology.usgs.gov/maps/mars-2020-jezero-crater-landing-site-controlled-orthomosaics.
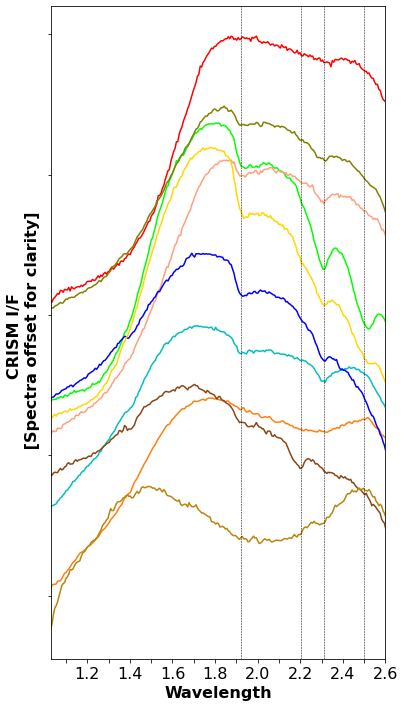
The map mosaic image 'jezeroFinal.tif' is in TIFF format and has a null (black space) value of 0. It shows the spatial distribution of the spectral prototypes depicted in the ancillary plot 'JezeroEM.png' following the same color convention. The prototype spectra are also collected in the attached ENVI spectral library. For each color in the map, bright tones represent very high confidence that the underlying pixel exhibit a spectrum very similar to the corresponding prototype. for darker tones, the confidence is slightly reduced, in the sense that there could be slight variations in the spectrum due to small residual artifacts. Color convention and preliminary mineral attributions can be found in 'Jezero_readme.pdf'.
The corrected hyperspectral cubes and the mineral maps derived from them were extensively validated by a concerted effort by research groups at the University of Massachusetts (UMass), Brown University, the Washington University in St. Louis (WashU), and the Johns Hopkins Applied Physics Laboratory (APL). The researchers verified the good correlation between the spectral products by the Umass group used to produce this published map with independently processed images by the WashU and APL groups. The mineral maps produced by the Umass group were validated by independent application of the DAFA/TT method proposed by the group at Brown University. DAFA/TT also helped identify some of the prototype spectra.
Notes
Files
Jezero_readme.pdf
Files
(1.8 MB)
| Name | Size | Download all |
|---|---|---|
|
md5:3a10cfc2b56b3dec17e0009ef6fb25af
|
292.8 kB | Preview Download |
|
md5:6818172b4998c5fd898b21257bd1188c
|
80.0 kB | Preview Download |
|
md5:797262c89e42149134b1cc147efaac66
|
1.4 MB | Preview Download |
|
md5:ad9ecb996720bac8ab549d9f4f2d1777
|
19.8 kB | Download |
|
md5:c87093db4190bcaa10044f70d24fda4a
|
3.2 kB | Download |
Additional details
Related works
- Is derived from
- Journal article: 10.1016/j.icarus.2020.114024 (DOI)
- 10.1016/j.icarus.2020.114107 (DOI)
References
- Yuki Itoh, Mario Parente (2021). A new method for atmospheric correction and de-noising of CRISM hyperspectral data, Icarus, Volume 354, 2021, 114024, ISSN 0019-1035, https://doi.org/10.1016/j.icarus.2020.114024.
- Arun M. Saranathan, Mario Parente (2021). Adversarial feature learning for improved mineral mapping of CRISM data, Icarus, Volume 355, 2021, 114107, ISSN 0019-1035, https://doi.org/10.1016/j.icarus.2020.114107.