Modeling Tumor:Lymphatic Interactions in Lymphatic Metas-tasis of Triple Negative Breast Cancer
Authors/Creators

- 1. Department of Pharmacology, Wayne State University, Detroit, MI
- 2. Department of Electrical and Computer Engineering, Wayne State University, Detroit, MI
- 3. Department of Cancer Physiology, Moffitt Cancer Center, Tampa, FL
Description
Supplemental Figure and Movie Legends
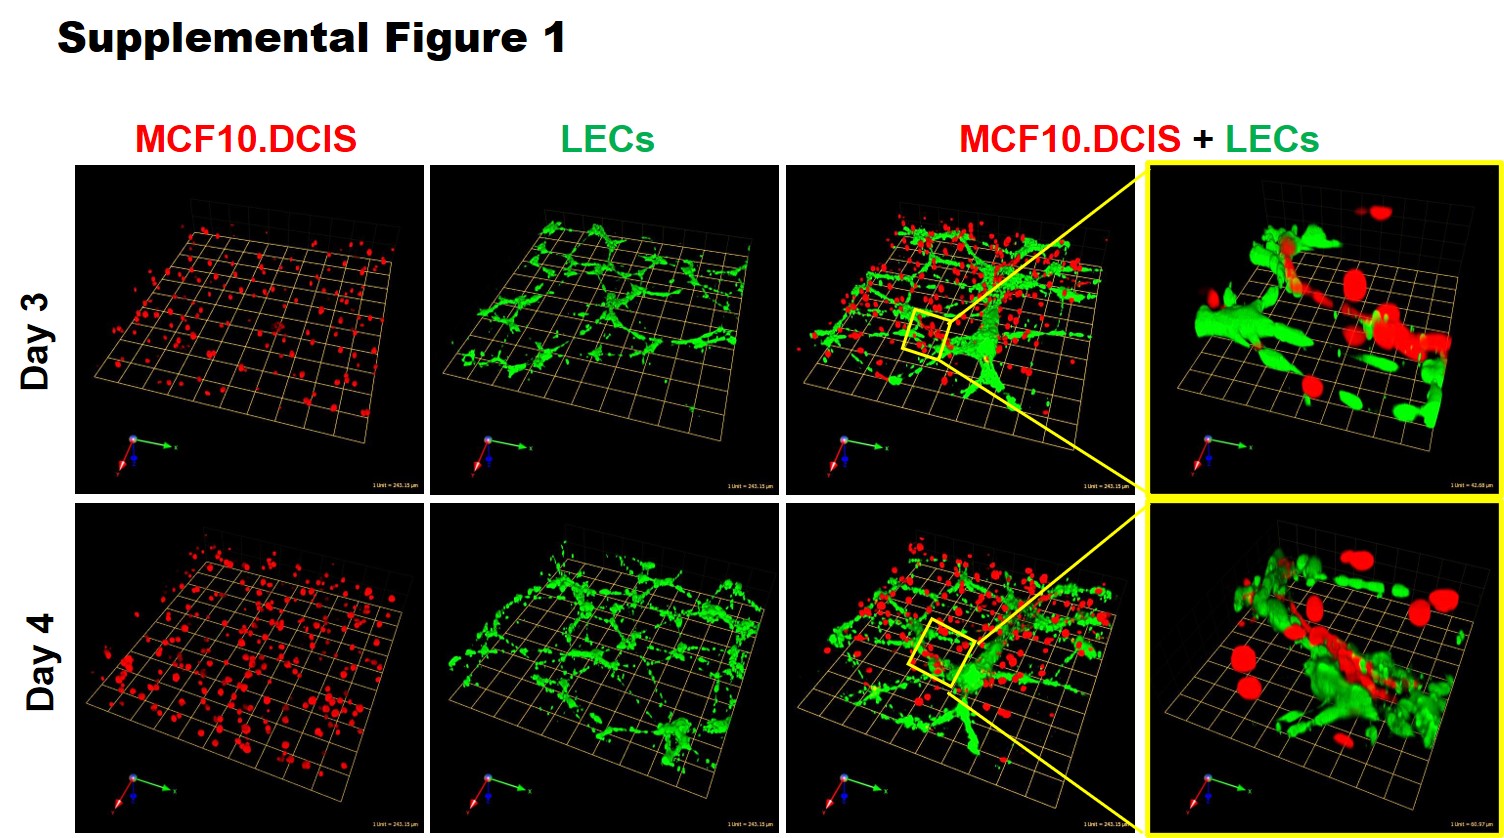
Supplemental Figure S1. Spatiotemporal changes in interactions between TN DCIS spheroids and LEC networks could be observed over 4 days of direct 3D coculture. Representative images of 3D reconstructions of monocultures of MCF10.DCIS, LECsBFS and MCF10.DCIS:LECBFS cocultures on days 3 and 4. Images are tiled from 16 contiguous fields; each grid represents 243 mm. Enlarged images on the right illustrate interactions between TN DCIS spheroids and LEC networks in greater detail; each grid represents 43 µm.
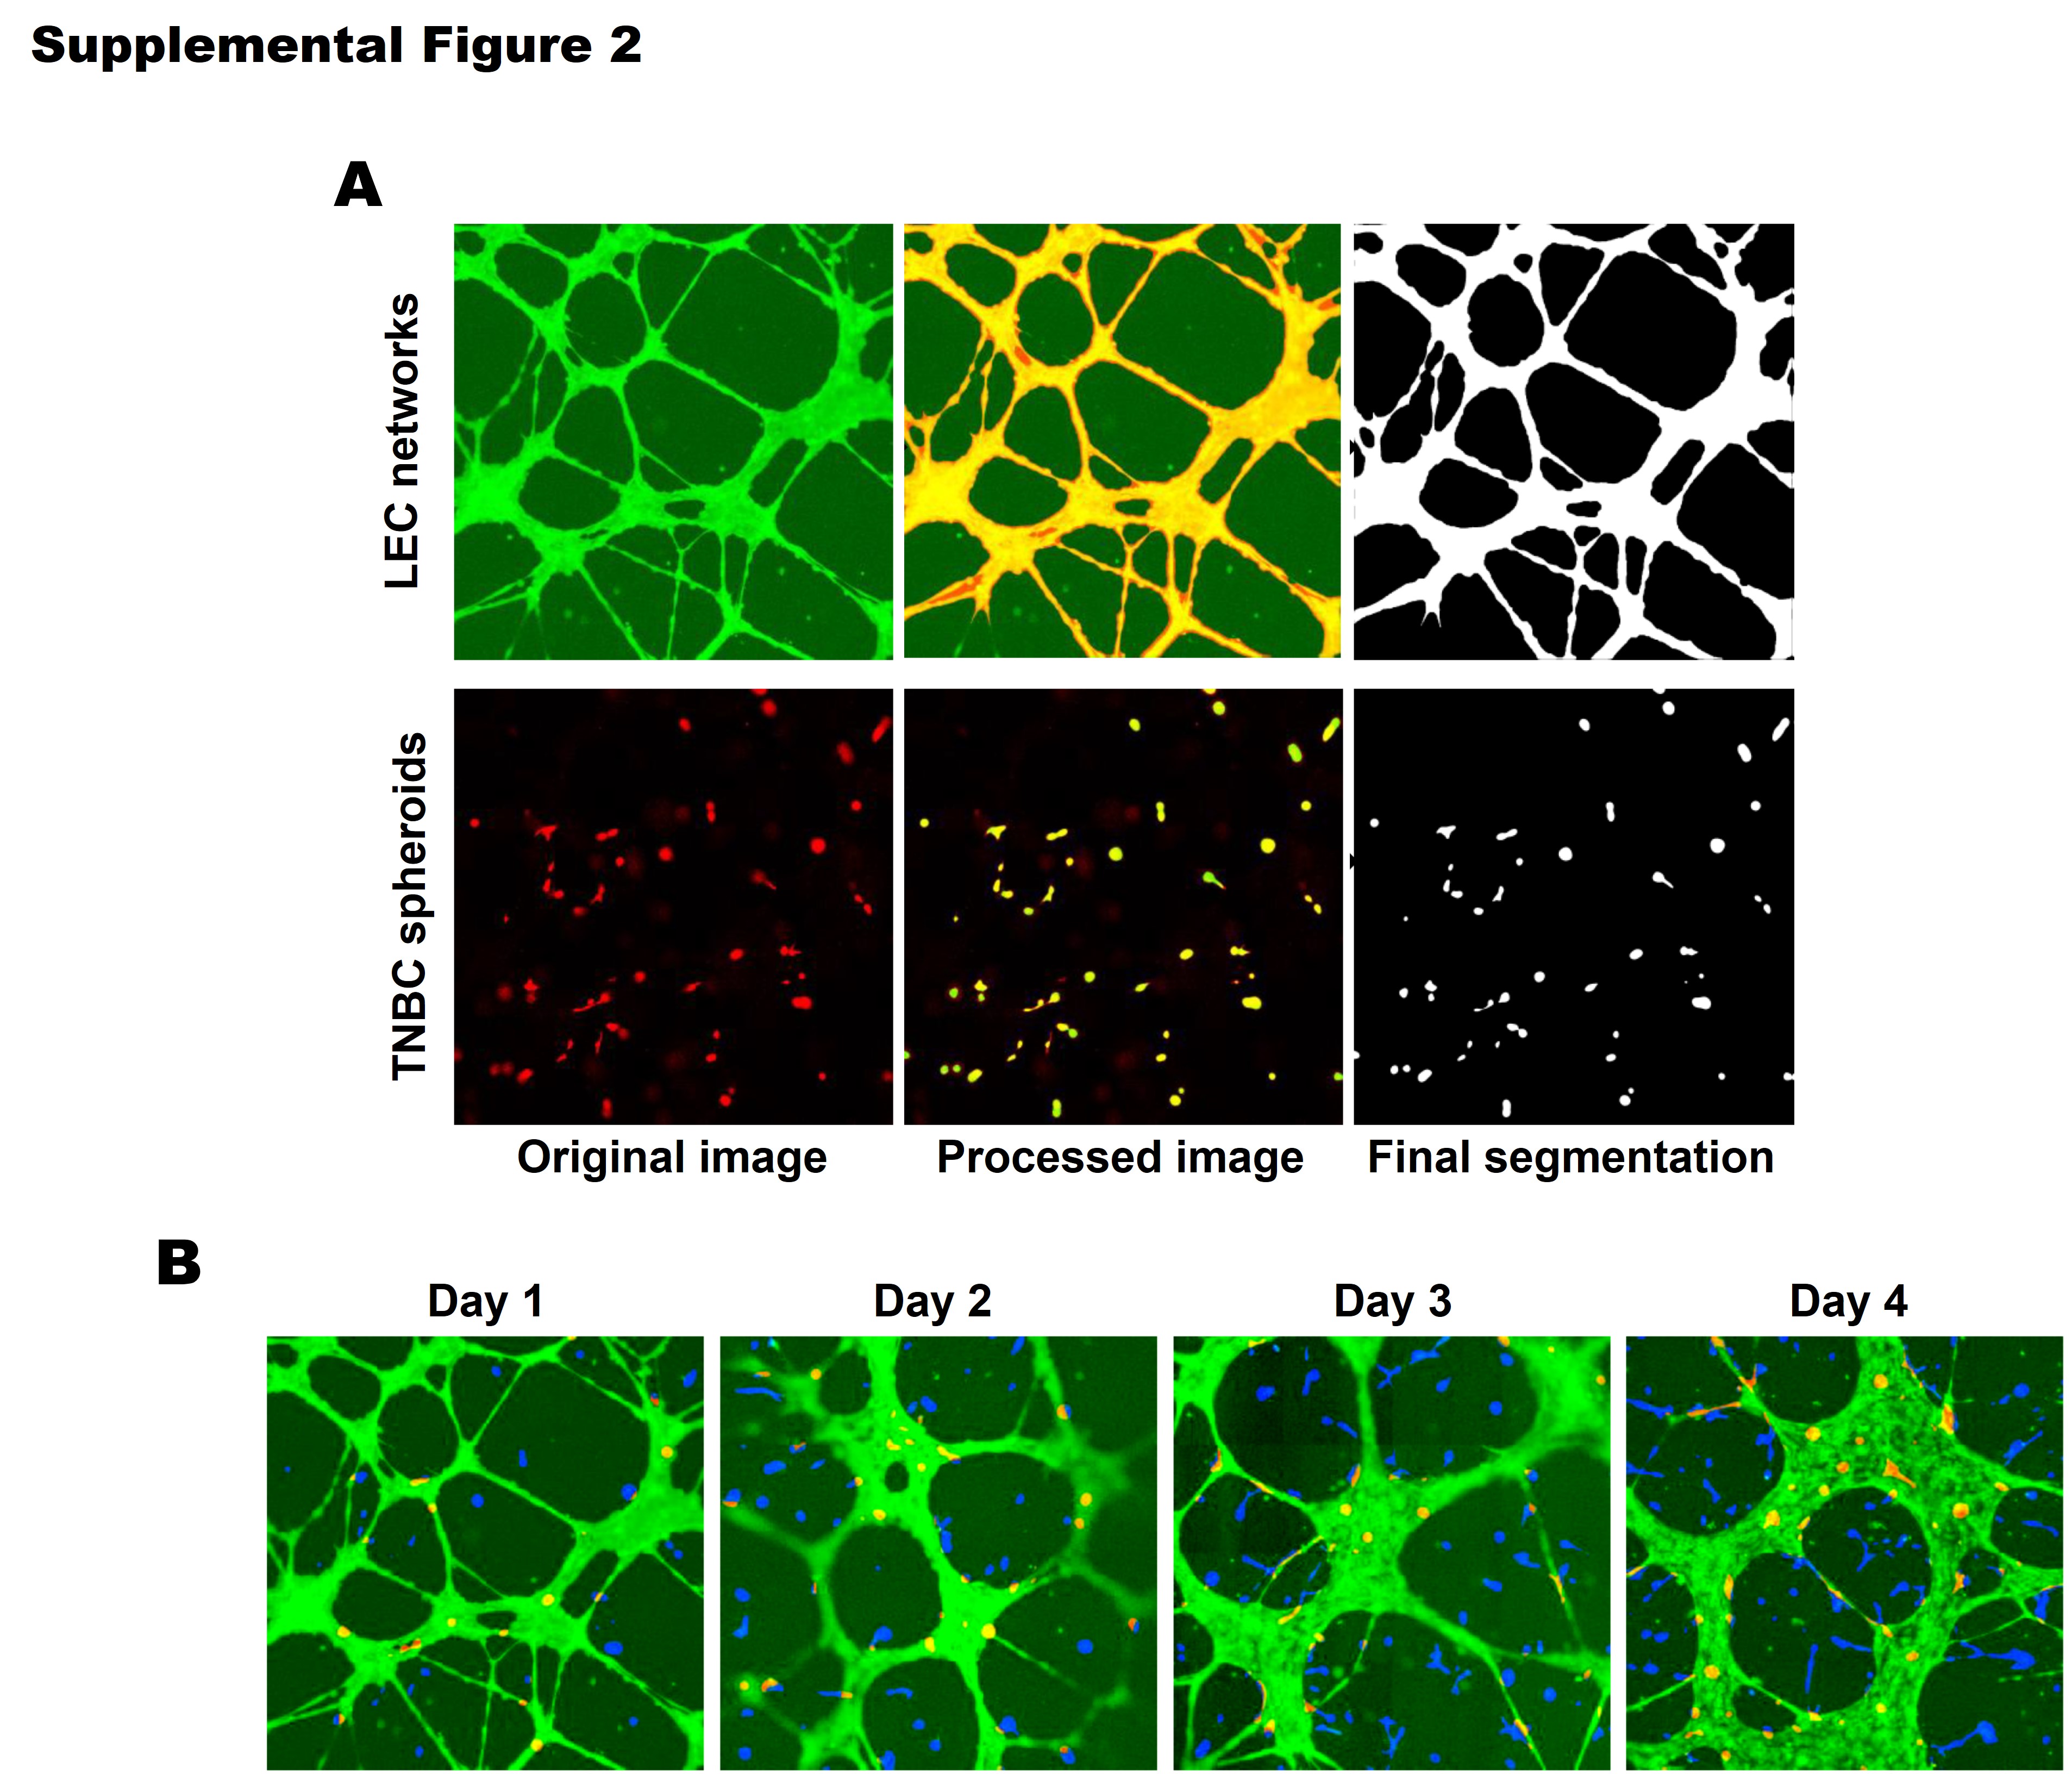
Supplemental Figure S2. Image processing and segmentation for quantification of TNBC:LEC interaction/overlap. (A) To quantify the interaction between 231 spheroids and LEC networks (red and green in original images, respectively), 3D images of each cell type were separately processed and segmented by the following hierarchical steps: contrast enhancement, image smoothing, noise removal, and then segmentation. (B) Segmentation masks were used for the quantification of overlap between 231 spheroids and LEC networks (green). Blue and orange represent 231 spheroids outside and inside LEC networks, respectively. Note that one image stack (extended depth of field) is shown for each timepoint.
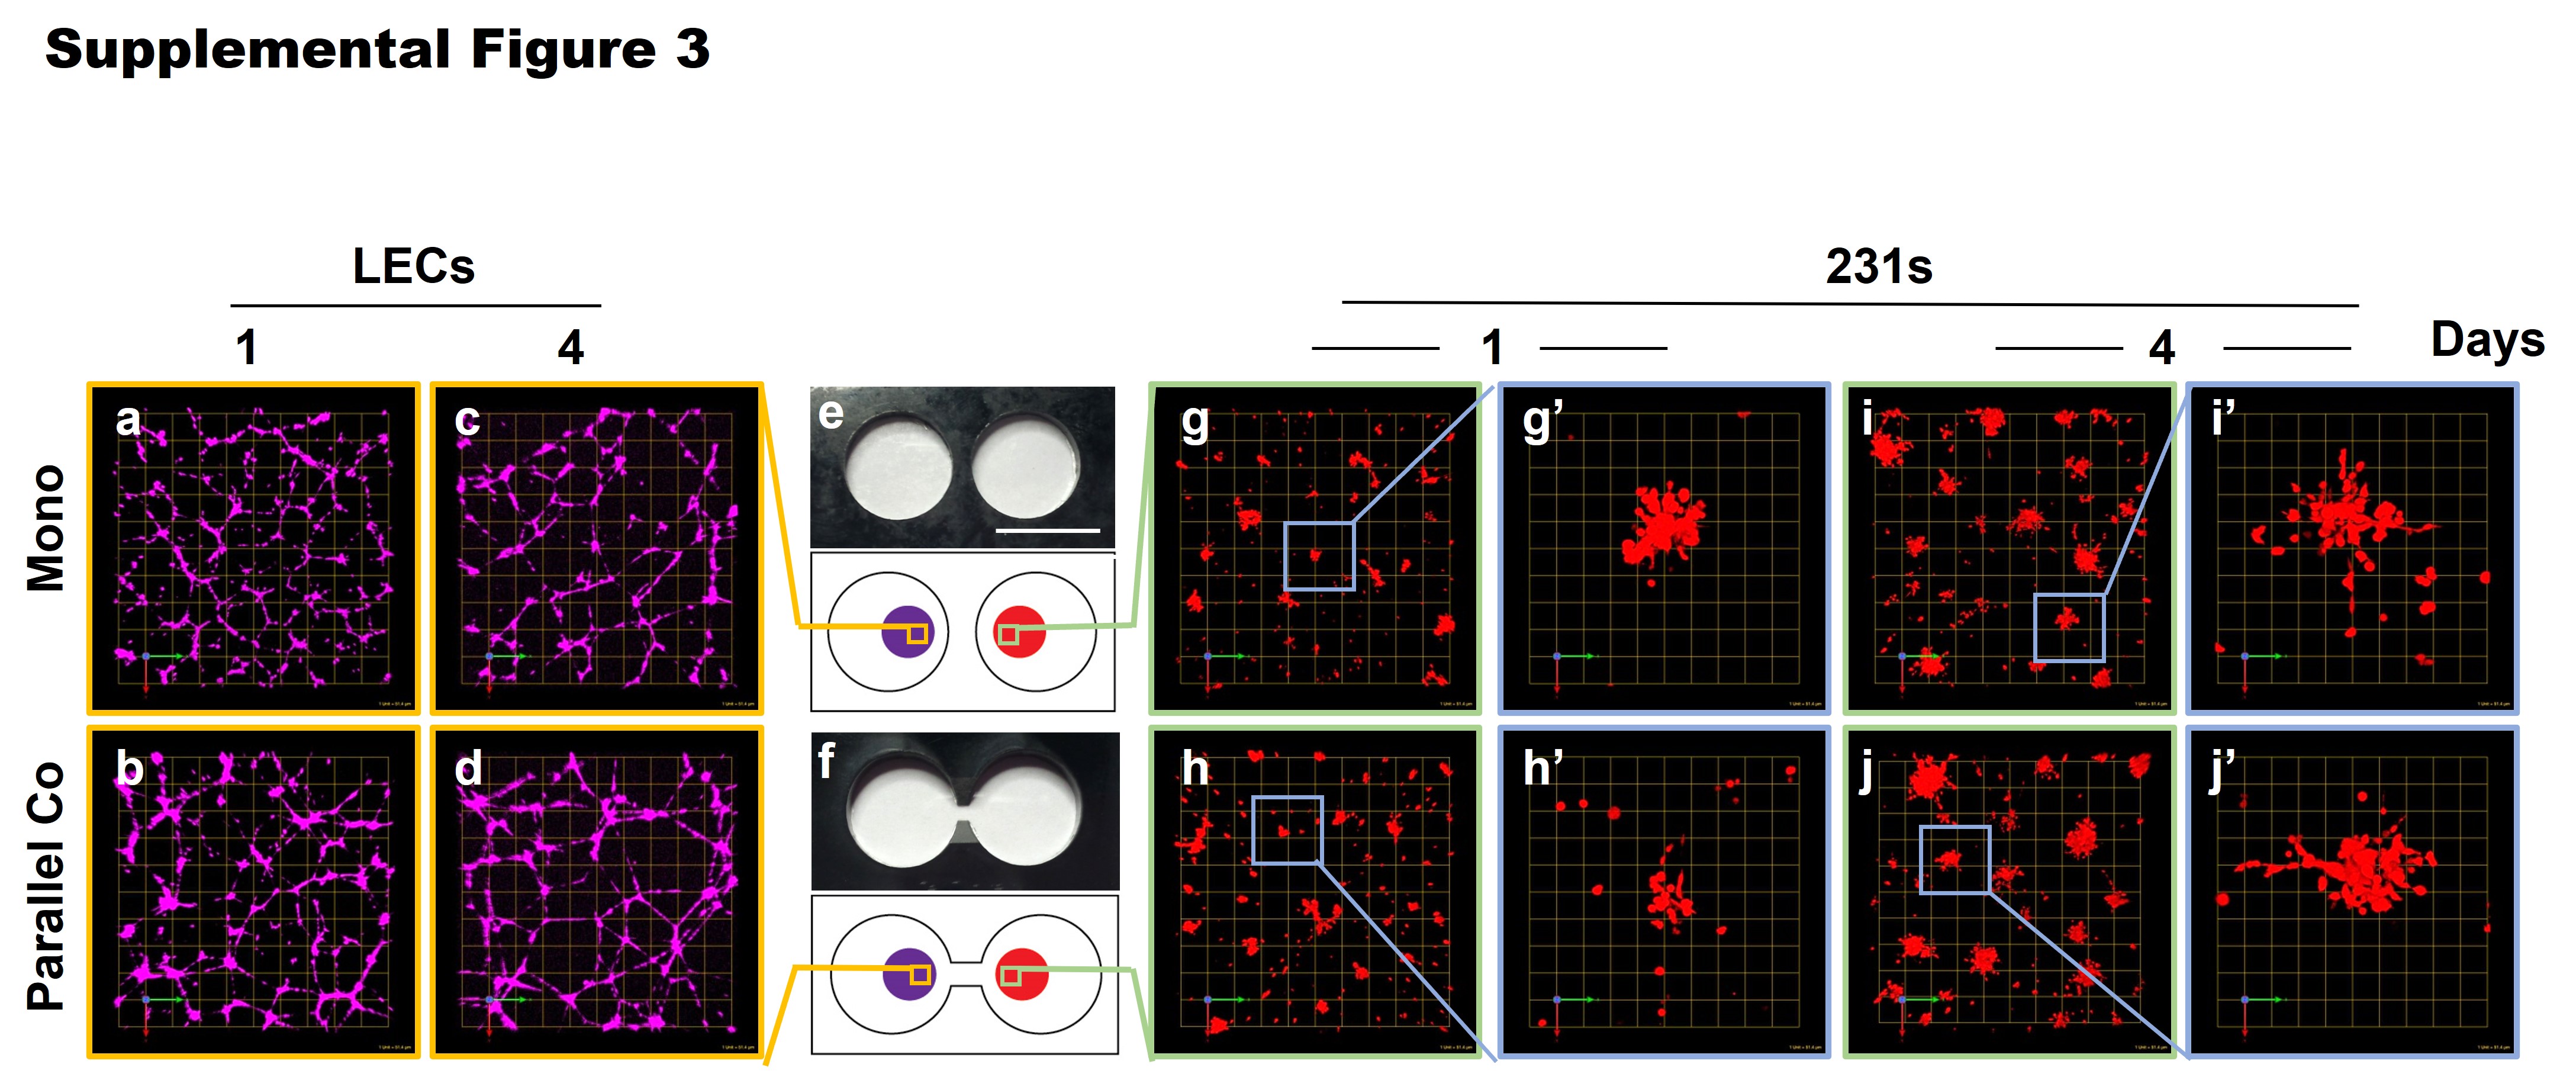
Supplemental Figure S3. Phenotypes of LEC networks and 231 spheroids in monoculture or in parallel coculture in TAME linked-well chambers at 1 or 4 days. Photos (top e, f) and schematics (bottom e, f) of TAME chambers with separate (top row) or linked (bottom row) wells. En-face views of 3D reconstructions of 3D monocultures (Mono) in separate-well chambers (top row) and parallel 3D cocultures (Parallel Co) in linked-well chambers (bottom row) of 231s (red) and LECsMG (purple) on days 1 and 4. Images are a single field with each grid in a-d and g-j representing 50 mm. Enlarged images (g’-j’) illustrate 231 spheroids in greater detail; each grid represents 10 mm. Scale bar in e represents 1.6 cm.
Supplemental Movie S1. Video of MCF10.DCIS spheroids interacting with BEC 3D tubule-like structures. 360° views of MCF10.DCIS-lenti-RFP spheroids (red) grown for 2 days in 3D coculture with blood vessel microvascular endothelial cell tubules (BEC, blue). For representative images of 3D reconstructions and experimental details, see Figure 1. Images were obtained on a Zeiss LSM 780 and converted to a movie file using Volocity® software. Each grid represents 45 μm.
Supplemental Movie S2. Video of MCF10.DCIS spheroids interacting with LEC 3D lymph node-like structure. 360° views of a MCF10.DCIS-lenti-RFP spheroids (red) grown for 2 days in 3D coculture with lymphatic microvascular endothelial cell lymph node-like structures (LEC, blue). For representative images of 3D reconstructions and experimental details, see Figure 1. Images were obtained on a Zeiss LSM 780 and converted to a movie file using Volocity® software. Each grid represents 45 μm.
Files
Supplemental figure 1.jpg
Files
(39.8 MB)
| Name | Size | Download all |
|---|---|---|
|
md5:9330c5d26839735365911887a57b36ed
|
316.3 kB | Preview Download |
|
md5:26624a48a4f9579ed4be80e58ffdbde9
|
1.1 MB | Preview Download |
|
md5:8cfa88ff936cf1ae54bba5679a62a04f
|
1.0 MB | Preview Download |
|
md5:4967bf56dcd97220130e782553337b89
|
21.0 MB | Download |
|
md5:645f75239f4b6f8df6f5353370457b3d
|
16.4 MB | Download |