PIANO (Penetration and Interruption of Alpine Foehn) - HOBO temperature and humidity logger data set
Authors/Creators

- 1. Department of Atmospheric and Cryospheric Sciences (ACINN), University of Innsbruck
- 2. Department of Statistics, University of Innsbruck
Description
ABSTRACT
This is the data set of 51 HOBO temperature and humidity loggers operated during the field campaign of the research project PIANO (Penetration and Interruption of Alpine Foehn) in the Inn Valley and Wipp Valley near Innsbruck, Austria, during fall and early winter 2017. The goal of the campaign was to study the erosion of cold air pools during south foehn and the associated foehn breakthrough at the valley floor in the vicinity of Innsbruck as well as the subsequent foehn breakdown. The campaign comprises seven Intensive Observation Periods (IOPs), more specifically six south foehn events (IOP 2 to IOP 7) and one west foehn (IOP 1). The HOBO data set does not only include the period of the PIANO field campaign but covers more than a year of data from mid July 2017 to mid November 2018.
DATA SET DESCRIPTION
1. Spatial coverage and locations
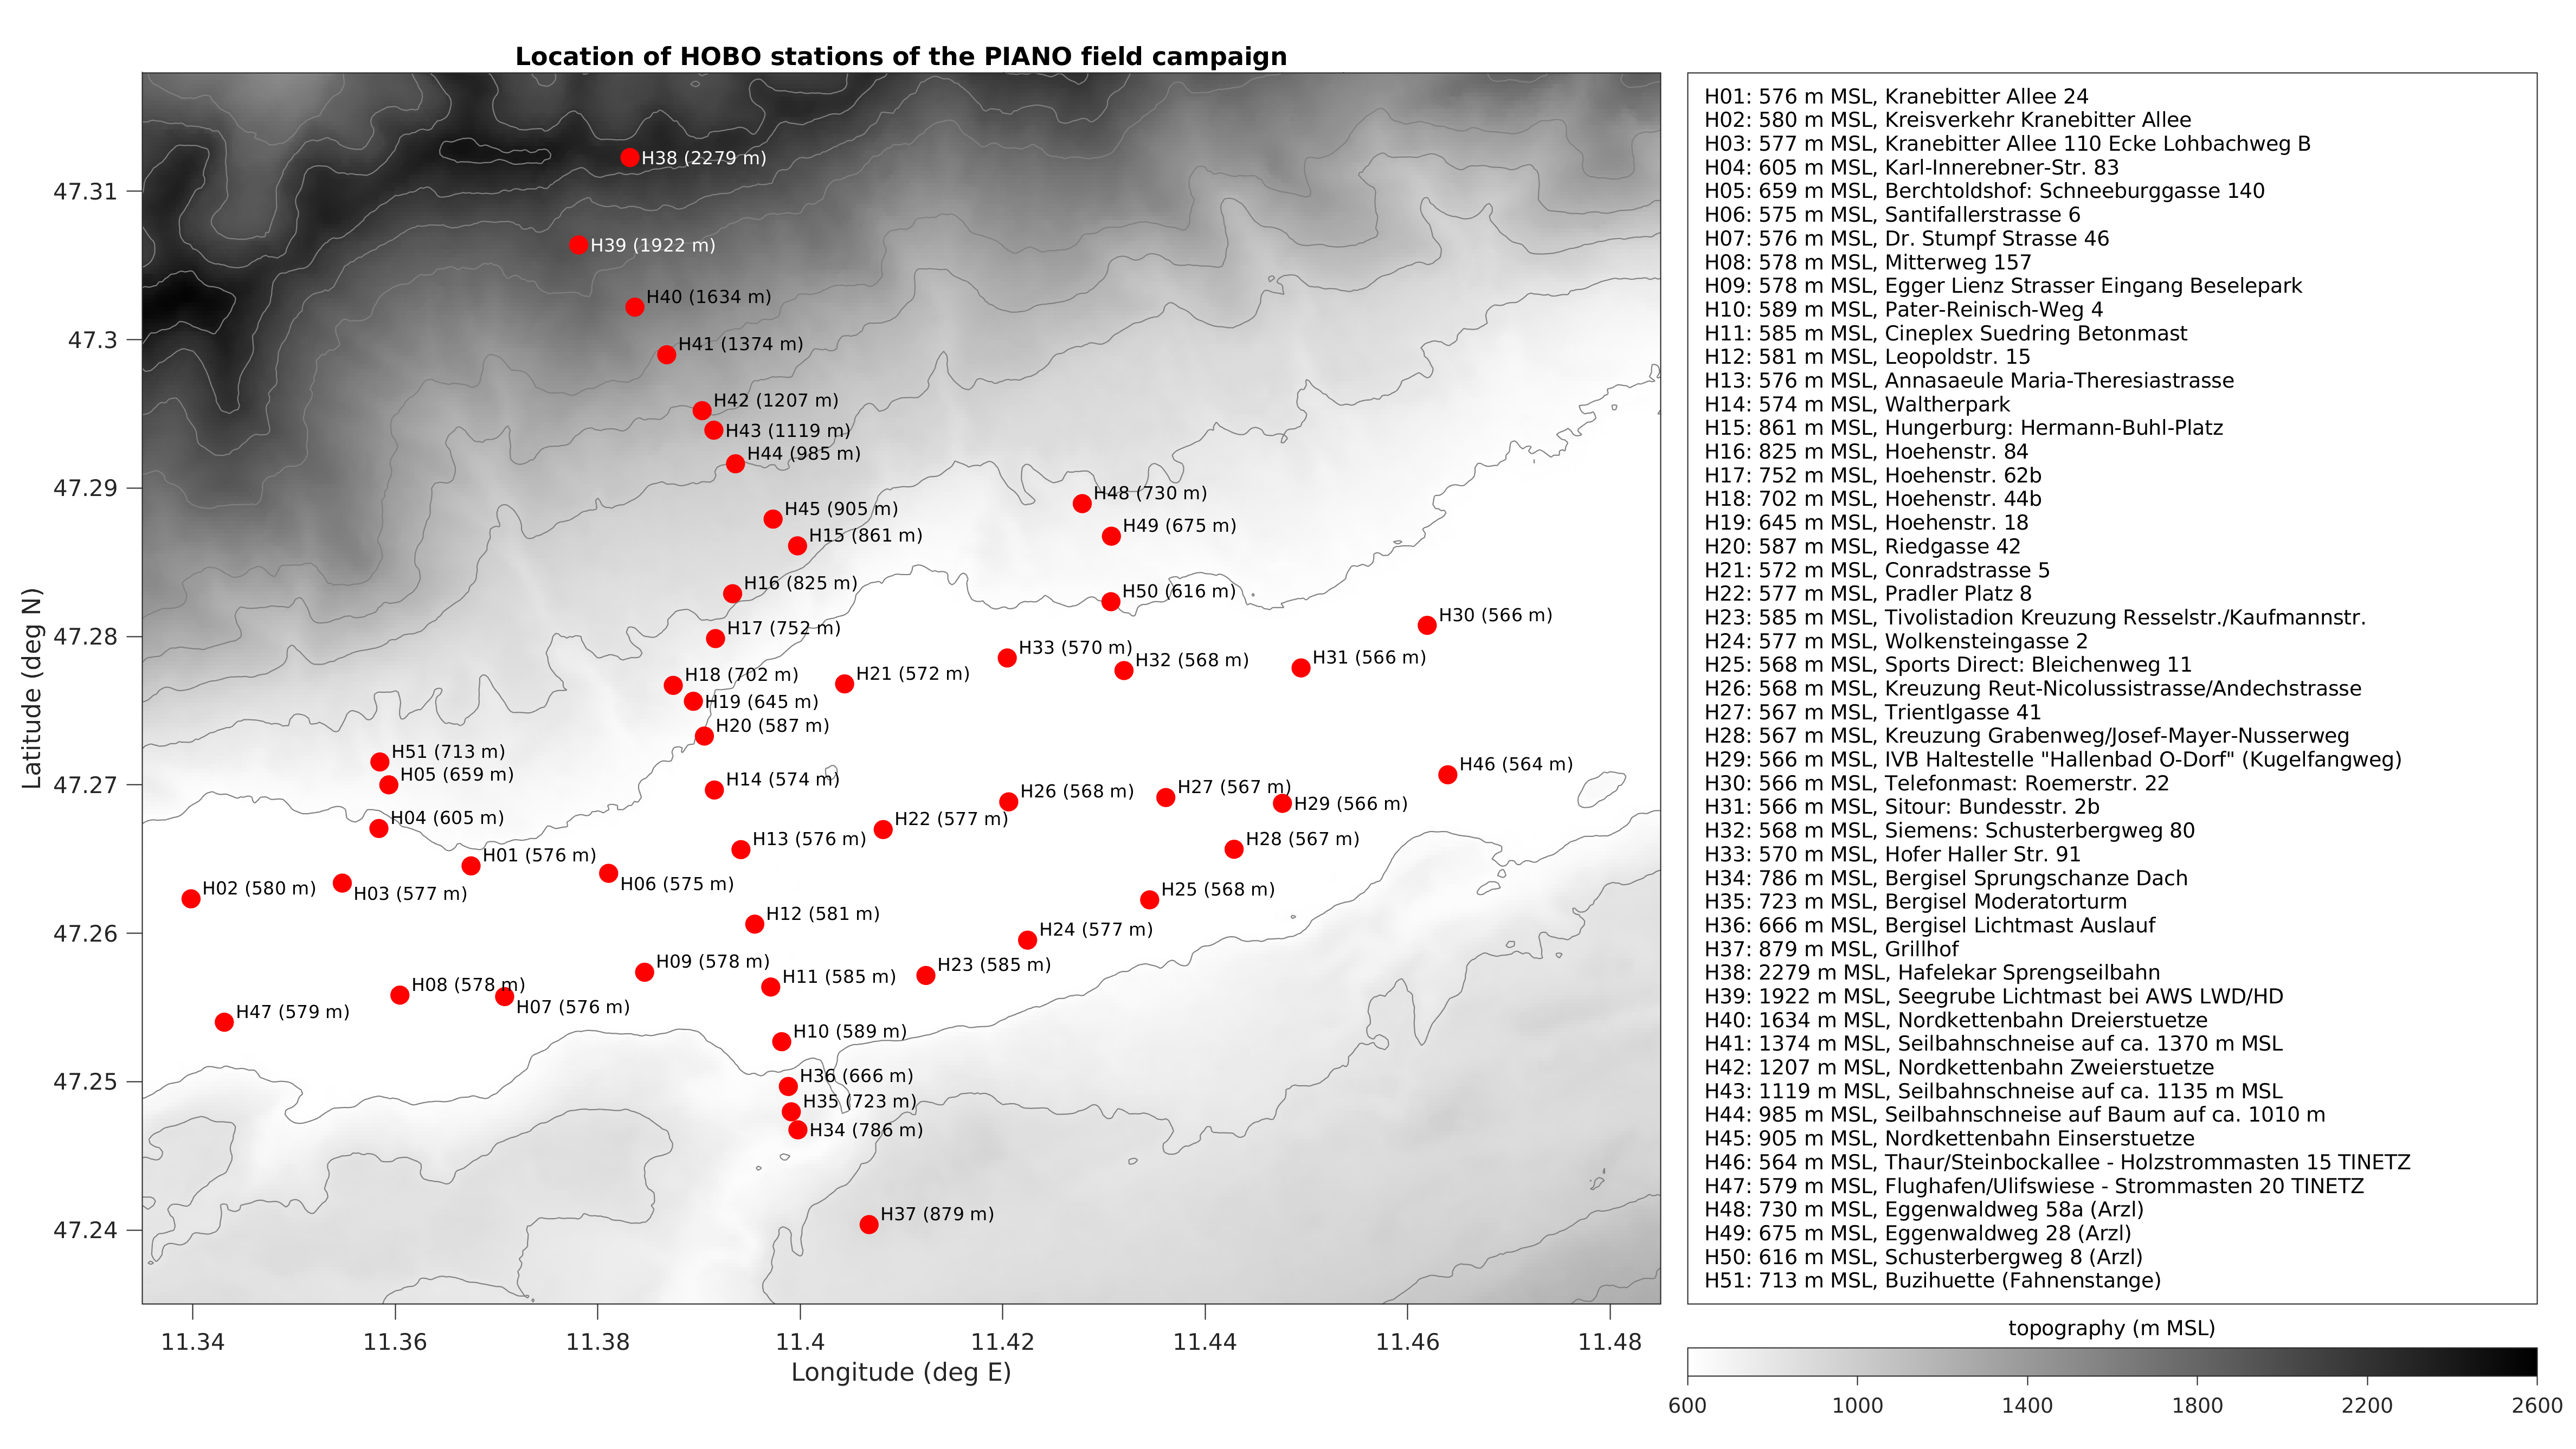
Measurements with the HOBO temperature and humidity loggers were collected during the PIANO field campaign in the greater Innsbruck area, Austria. Most of the loggers were operated at the valley floor on a roughly 1 x 1 km2 grid. A subset of these loggers was deployed along four slope profiles north, south, east and west of the city center. The northern, western and eastern profiles were located on the northern side of the Inn Valley. Of these, the western and eastern profiles were more shallow and reached to approximately 150 m above the valley floor. The southern profile reached to 300 m above the valley floor. The central northern profile extended up to the Nordkette ridge at Hafelekar (1700 m above valley floor).
2. Temporal coverage
The PIANO field campaign took place during fall and early winter 2017. However, the HOBO data set is available for a longer period from mid July 2017 to mid November 2018. Due to malfunctions, not all loggers measured continuously during this period. Some loggers have longer data gaps of more than two months (see overview figure of HOBO data set).
3. Instrument details
Sensor type and radiation shield
Measurements were taken with 51 temperature and relative humidity loggers of type HOBO MX2302, manufactured by Onset Computer Corporation. The logger's external temperature and relative humidity sensors were protected from direct solar radiation by a naturally ventilated multi-plate radiation shield of type RS3-B, also manufactured by Onset.
HOBO ID number and serial number
The HOBO ID numbers H01 to H51 in the data files refer to the 51 locations where measurements were taken. GPS coordinates and heights of these locations are provided in the data files. Some of the loggers malfunctioned and needed to be replaced. For this reason, the data files also contain the serial numbers and the operation period of the loggers deployed at each location.
Time and measurement interval
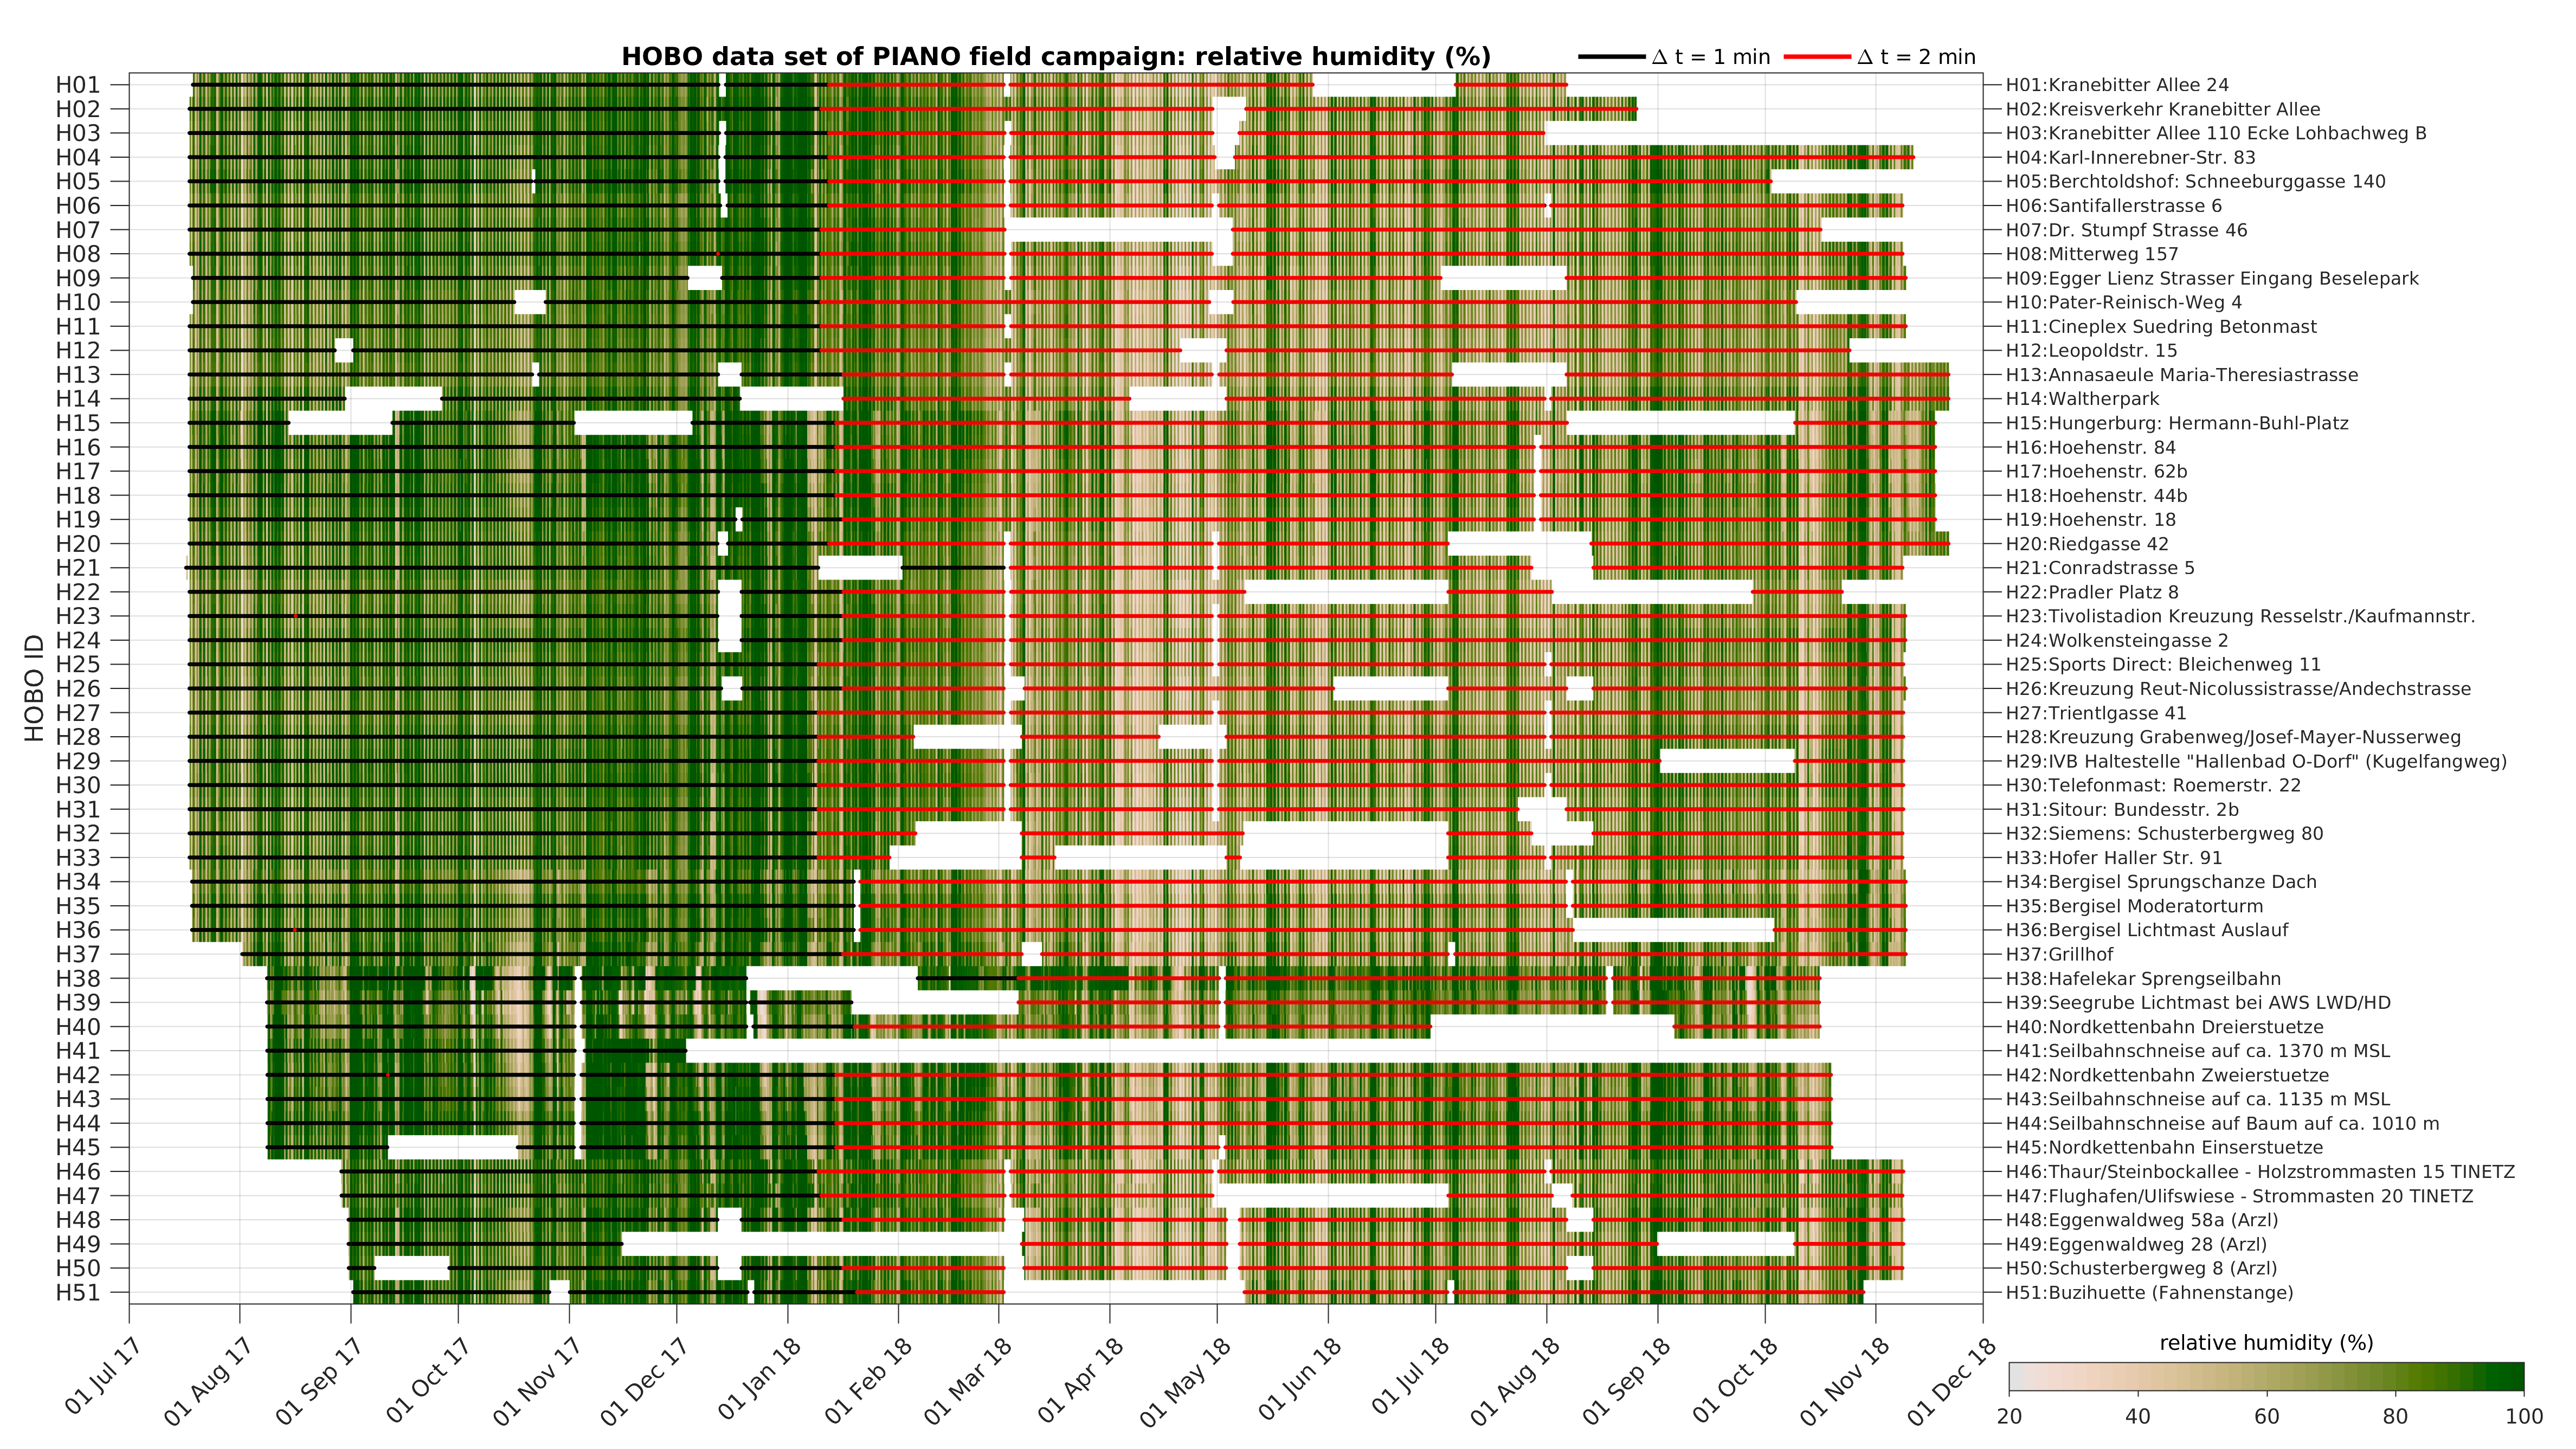
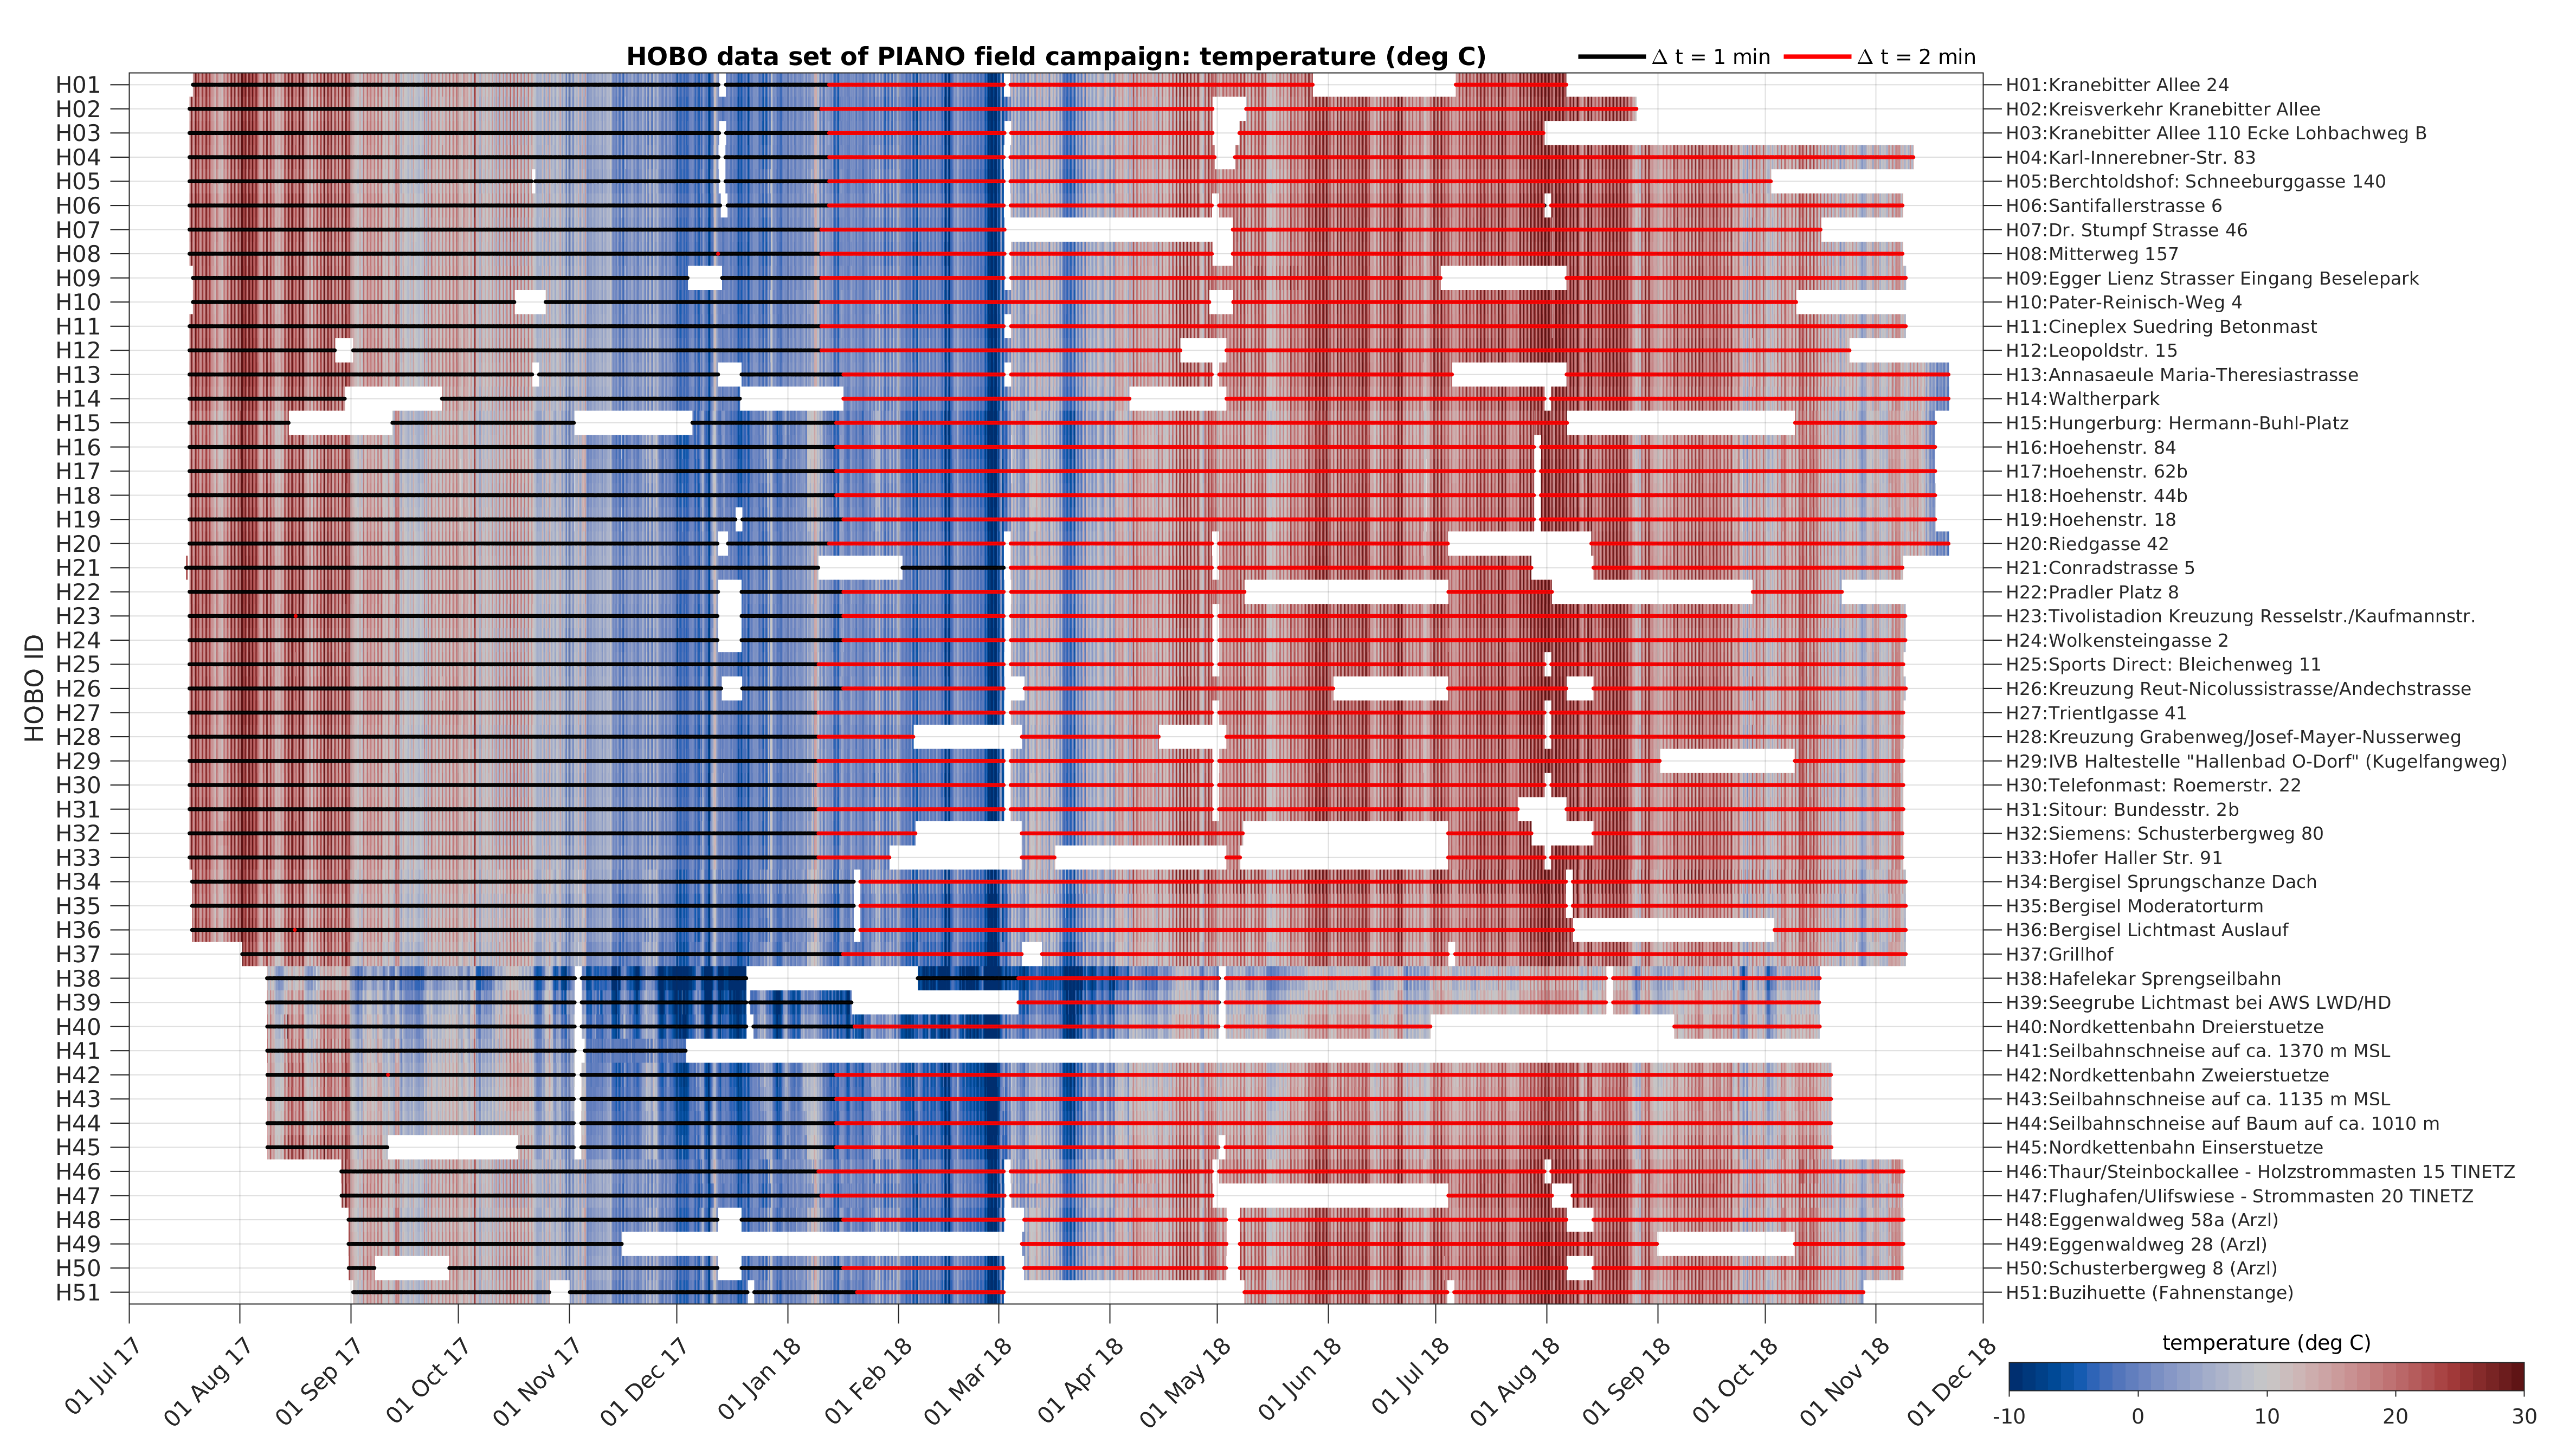
Time in the data files is in UTC. All temperature and humidity values are instantaneous measurements. The measurement interval is 1 minute during the PIANO campaign in 2017 and 2 minutes from the beginning of January 2018 (see overview figure of HOBO data set). The change from 1 to 2 minutes became necessary to avoid memory overflow as a result of a decrease in the frequency of station visits for data downloading after the PIANO campaign. Regardless of this change, the complete time series in the data files exhibits a constant time interval of 1 minute, however, filled with NaNs if no measurement is available at a certain minute.
Installation height
The majority of HOBO sensors were deployed 4 m above ground level (AGL) on the northern side of street lamps and power or cable car pylons. Exceptions to the standardized installation height were made out of necessity at the southern profile (loggers H34, H35 and H37) and at the central northern profile (loggers H39, H41, H43 and H44). H35 was installed on a metal structure 10 to 20 m above a steep slope and H34 was installed on top of a ski jump tower, less than 1 m above the roof, but around 50 m AGL. H37, the highest station of the southern profile, was located on top of a flagpole at about 5 m AGL. For the northern profile the following HOBO loggers were mounted at 2 m AGL: H44 and H43 on a tree, H41 on a tent pole, and H39 on a lamp pole. Under very calm conditions and with a strong positive or negative radiation balance at the surface (e.g. during sunny days or clear nights), these differences in installation height could be influential.
Measurement accuracy and data correction
According to the manufacturer’s specifications, the Onset HOBO MX2302 measures temperature and relative humidity (RH) externally with an accuracy of 0.2 K and 2.5 % RH (between 10 % and 90 % RH), respectively. The temperature sensor has a resolution of 0.04 K and drifts less than 0.01 K per year. The RH sensor has a resolution of 0.05 % and a drift of less than 1 % per year. The response times (to 90 % change) of temperature and RH are 5 and 4 minutes, respectively, for air moving 1 m s-1 and with the sensors mounted inside the RS3-B radiation shield.
Before the measurement campaign, all HOBO loggers were mounted on the University of Innsbruck rooftop for comparison measurements. The observed differences in temperature between loggers were on the order of 0.2 K and, thus, comparable to the measurement accuracy. Therefore, no corrections have been applied to the data set provided here.
4. Data file structure
File format
Provided are data in netCDF format as well as overview figures in PNG format. Each netCDF file contains data of one month. File names contain date information. The following wildcard characters are used in the file example below: yyyy - year; mm - month.
Data
yyyymm_hobo.nc is a netCDF file that contains HOBO data of a specific month. A total of 17 files are provided for the period July 2017 to November 2018.
Overview figures
hobo_locations.png illustrates the locations of the HOBO loggers on a terrain map.
hobo_overview_temperature.png illustrates the whole temperature data set. It is useful for assessing data availability and the change in the measurement interval from 1 to 2 minutes.
hobo_overview_relative_humidity.png illustrates the whole relative humidity data set. It is useful for assessing data availability and the change in the measurement interval from 1 to 2 minutes.
5. Publications
The HOBO data set is described and analyzed in Muschinski (2019) and Muschinski et al. (2020) with respect to the cold air pool structure in the Inn Valley during south foehn. The data set is also used in Rzehak (2018) and Schmitt (2018) to study Innsbruck's urban heat island in summer and winter, respectively. Furthermore, HOBO data is analyzed in two case studies of PIANO IOP 2 (Haid et al. 2020, Umek et al. 2021).
6. Contact
Contact alexander.gohm (at) uibk.ac.at for any questions regarding the data set.
7. Acknowledgements
The PIANO field campaign was supported by the Austrian Science Fund (FWF) and the Weiss Science Foundation under Grant P29746-N32, by KIT IMK-IFU, Austro Control GmbH, Zentralanstalt für Meteorologie und Geodynamik (ZAMG), the Hydrographic Service of Tyrol, Innsbrucker Kommunalbetriebe AG (IKB), Bergisel Betriebsgesellschaft m.b.H., Innsbrucker Nordkettenbahnen Betriebs GmbH, T-Mobile Austria GmbH, Unser Lagerhaus Warenhandelsgesellschaft, PEMA Immobilien GmbH, HTL Anichstraße, Hilton Innsbruck, TINETZ-Tiroler Netze GmbH, Land Tirol, and the communities Patsch and Völs.
8. References
Haid, M., A. Gohm, L. Umek, H. C. Ward, T. Muschinski, L. Lehner, and M. W. Rotach, 2020: Foehn-cold pool interactions in the Inn Valley during PIANO IOP2. Quarterly Journal of the Royal Meteorological Society, 146, 1232–1263, https://doi.org/10.1002/qj.3735
Muschinski, T., 2019: Spatial heterogeneity of the pre-foehnic Inn Valley cold air pool and a relationship to Froude number: Observations from an array of temperature loggers during PIANO. Master's Thesis. Department of Atmospheric and Cryospheric Sciences, Unversity of Innsbruck, 101 pp., https://resolver.obvsg.at/urn:nbn:at:at-ubi:1-43559
Muschinsik, T., A. Gohm, M. Haid, L. Umek, and H. C. Ward, 2020: Spatial heterogeneity of the Inn Valley cold air pool during south foehn: Observations from an array of temperature loggers during PIANO. Meteorologische Zeitschrift, https://doi.org/10.1127/metz/2020/1043
Rzehak, S., 2018: Städtische Wärmeinsel in Innsbruck im Sommer. Bachelor Thesis, Department of Atmospheric and Cryospheric Sciences, Unversity of Innsbruck, 46 pp.
Schmitt, P., 2018: Städtische Wärmeinsel in Innsbruck im Winter: Untersucht im Zeitraum Dezember 2017 bis Februar 2018. Bachelor Thesis, Department of Atmospheric and Cryospheric Sciences, Unversity of Innsbruck, 73 pp.
Umek, L., A. Gohm, M. Haid, H. C. Ward, and M. W. Rotach, 2021: Large‐eddy simulation of foehn–cold pool interactions in the Inn Valley during PIANO IOP 2. Quarterly Journal of the Royal Meteorological Society, 147, 944–982, https://doi.org/10.1002/qj.3954
Files
hobo_locations.png
Files
(691.0 MB)
| Name | Size | |
|---|---|---|
|
md5:9b667fbbffbea63c47fd99fc618ac8d9
|
41.0 MB | Download |
|
md5:29dd6ce33b76c6421f883b35f291ffa7
|
41.0 MB | Download |
|
md5:88f42b13fc328512a7e19fbbb0f3fdac
|
39.7 MB | Download |
|
md5:0d489613b25ae941c5a30556ada0b606
|
41.0 MB | Download |
|
md5:a8aa52d6bfc0e794d93b48cc3b59f9e2
|
39.7 MB | Download |
|
md5:dfe98cca90747eb495f31284f1ae8ba6
|
41.0 MB | Download |
|
md5:fd05c9d5f5f1adbcdac2f6039f066736
|
41.0 MB | Download |
|
md5:9ff31fe2f723c8803c6fdc3f854cd01e
|
37.0 MB | Download |
|
md5:d4c586117df307fe1aae382a31e9b6b0
|
41.0 MB | Download |
|
md5:d884022e735658d8bfc4fe43272198a6
|
39.7 MB | Download |
|
md5:28584c6fa7af6dd06e947a36b7dd7c3d
|
41.0 MB | Download |
|
md5:d291e680f351cb0ad0dbc352b2ee1ce8
|
39.7 MB | Download |
|
md5:6c29305e3e385d2b7f2748951f0ff5b0
|
41.0 MB | Download |
|
md5:6f65174963b27148ed0fbc6afe3159e0
|
41.0 MB | Download |
|
md5:899d535dab7636044dab5d1c021787df
|
39.7 MB | Download |
|
md5:98b5b3bab346afaa225fe9e1ce455883
|
41.0 MB | Download |
|
md5:c6f35dbf973a510d64873d1533747d80
|
39.7 MB | Download |
|
md5:3137b45a0bf08aefc71e08bb8bce08b7
|
1.4 MB | Preview Download |
|
md5:3bad14006bb466dff21b8eedbb9a5c63
|
2.1 MB | Preview Download |
|
md5:4c85d25a1b571d43b7b123fb23f6f90b
|
2.1 MB | Preview Download |
|
md5:353301e7dfc8ef078ca5aea3ee060e7f
|
9.6 kB | Preview Download |
|
md5:597624f7cabb36e59e2e0643201f36c9
|
168.9 kB | Preview Download |
Additional details
Funding
- FWF Austrian Science Fund
- Penetration and Interruption of Alpine Foehn (PIANO) P 29746
References
- Haid, M., A. Gohm, L. Umek, H. C. Ward, T. Muschinski, L. Lehner, and M. W. Rotach, 2020: Foehn-cold pool interactions in the Inn Valley during PIANO IOP2. Quarterly Journal of the Royal Meteorological Society, 146, 1232–1263, https://doi.org/10.1002/qj.3735
- Muschinski, T., 2019: Spatial heterogeneity of the pre-foehnic Inn Valley cold air pool and a relationship to Froude number: Observations from an array of temperature loggers during PIANO. Master's Thesis. Department of Atmospheric and Cryospheric Sciences, Unversity of Innsbruck, 101 pp., https://resolver.obvsg.at/urn:nbn:at:at-ubi:1-43559
- Muschinsik, T., A. Gohm, M. Haid, L. Umek, and H. C. Ward, 2020: Spatial heterogeneity of the Inn Valley cold air pool during south foehn: Observations from an array of temperature loggers during PIANO. Meteorologische Zeitschrift, https://doi.org/10.1127/metz/2020/1043
- Rzehak, S., 2018: Städtische Wärmeinsel in Innsbruck im Sommer. Bachelor Thesis, Department of Atmospheric and Cryospheric Sciences, Unversity of Innsbruck, 46 pp.
- Schmitt, P., 2018: Städtische Wärmeinsel in Innsbruck im Winter: Untersucht im Zeitraum Dezember 2017 bis Februar 2018. Bachelor Thesis, Department of Atmospheric and Cryospheric Sciences, Unversity of Innsbruck, 73 pp.
- Umek, L., A. Gohm, M. Haid, H. C. Ward, and M. W. Rotach, 2021: Large‐eddy simulation of foehn–cold pool interactions in the Inn Valley during PIANO IOP 2. Quarterly Journal of the Royal Meteorological Society, 147, 944–982, https://doi.org/10.1002/qj.3954