FIGURE 1. Species richness and sampling density. A in Tardigrades of Finland: new records and an annotated checklist

- 1. Department of Biological and Environmental Science, University of Jyvaskyla, PO Box 35, FI-40014, Finland & matteo.vecchi15@gmail.com; https://orcid.org/0000-0002-7995-6827
- 2. Department of Life Science, University of Modena and Reggio Emilia, via G. Campi 213/D, 41125 Modena, Italy
Description
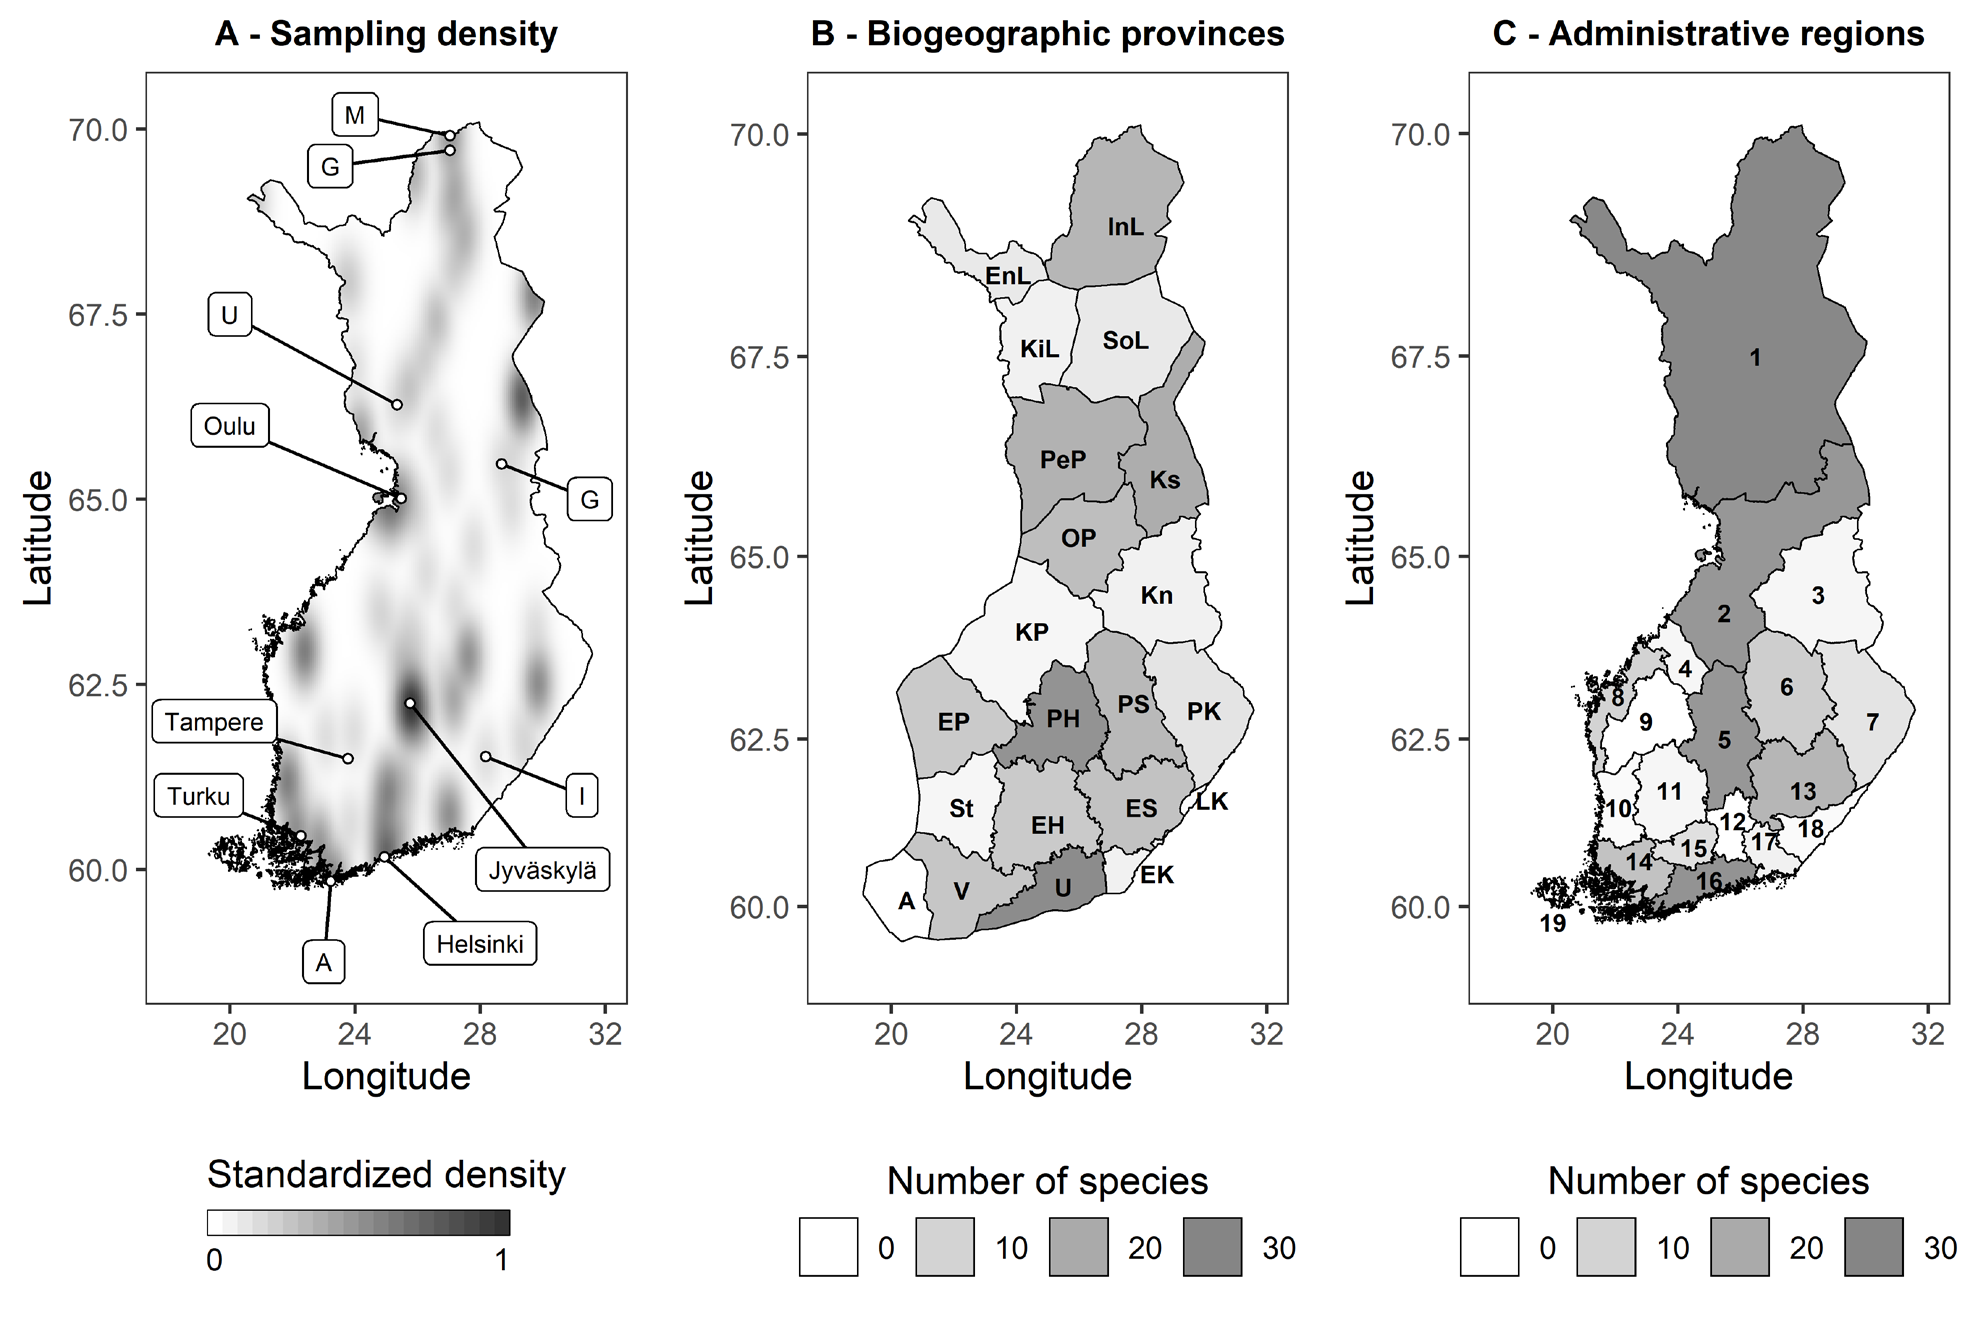
FIGURE 1. Species richness and sampling density. A) Sampling density map. Type localities in Finland shown (A: type locality of Acanthechiniscus distinctus, G: type localities of Grevenius pulcher, I: type locality of Itaquascon enckelli, M: type locality of Milnesium quadrifidum, U: neotype locality of Ursulinius septentrionalis). Additionally, biggest five Finnish cities by population shown; B) Species richness by biogeographical province (For abbreviations see https://laji.fi/theme/emk); C) Species richness by administrative region (1 = Lapland, 2 = North Ostrobothnia, 3 = Kainuu, 4 = Central Ostrobothnia, 5 = Central Finland, 6 = North Savo, 7 = North Karelia, 8 = Ostrobothnia, 9 = South Ostrobothnia, 10 = Satakunta, 11 = Pirkanmaa, 12 = Päijät-Häme, 13 = South Savo, 14 = Southwest Finland, 15 = Kanta-Häme, 16 = Uusimaa, 17 = Kymenlaakso, 18 = South Karelia, 19 = Åland).
Notes
Files
figure.png
Files
(461.8 kB)
| Name | Size | Download all |
|---|---|---|
|
md5:85b9d14ace61c9a11256e3a7366dfab7
|
461.8 kB | Preview Download |