Published October 16, 2020
| Version v1
Journal article
Open
Pseudo-spatially-distributed modeling of water balance components in the Free State of Saxony
Description
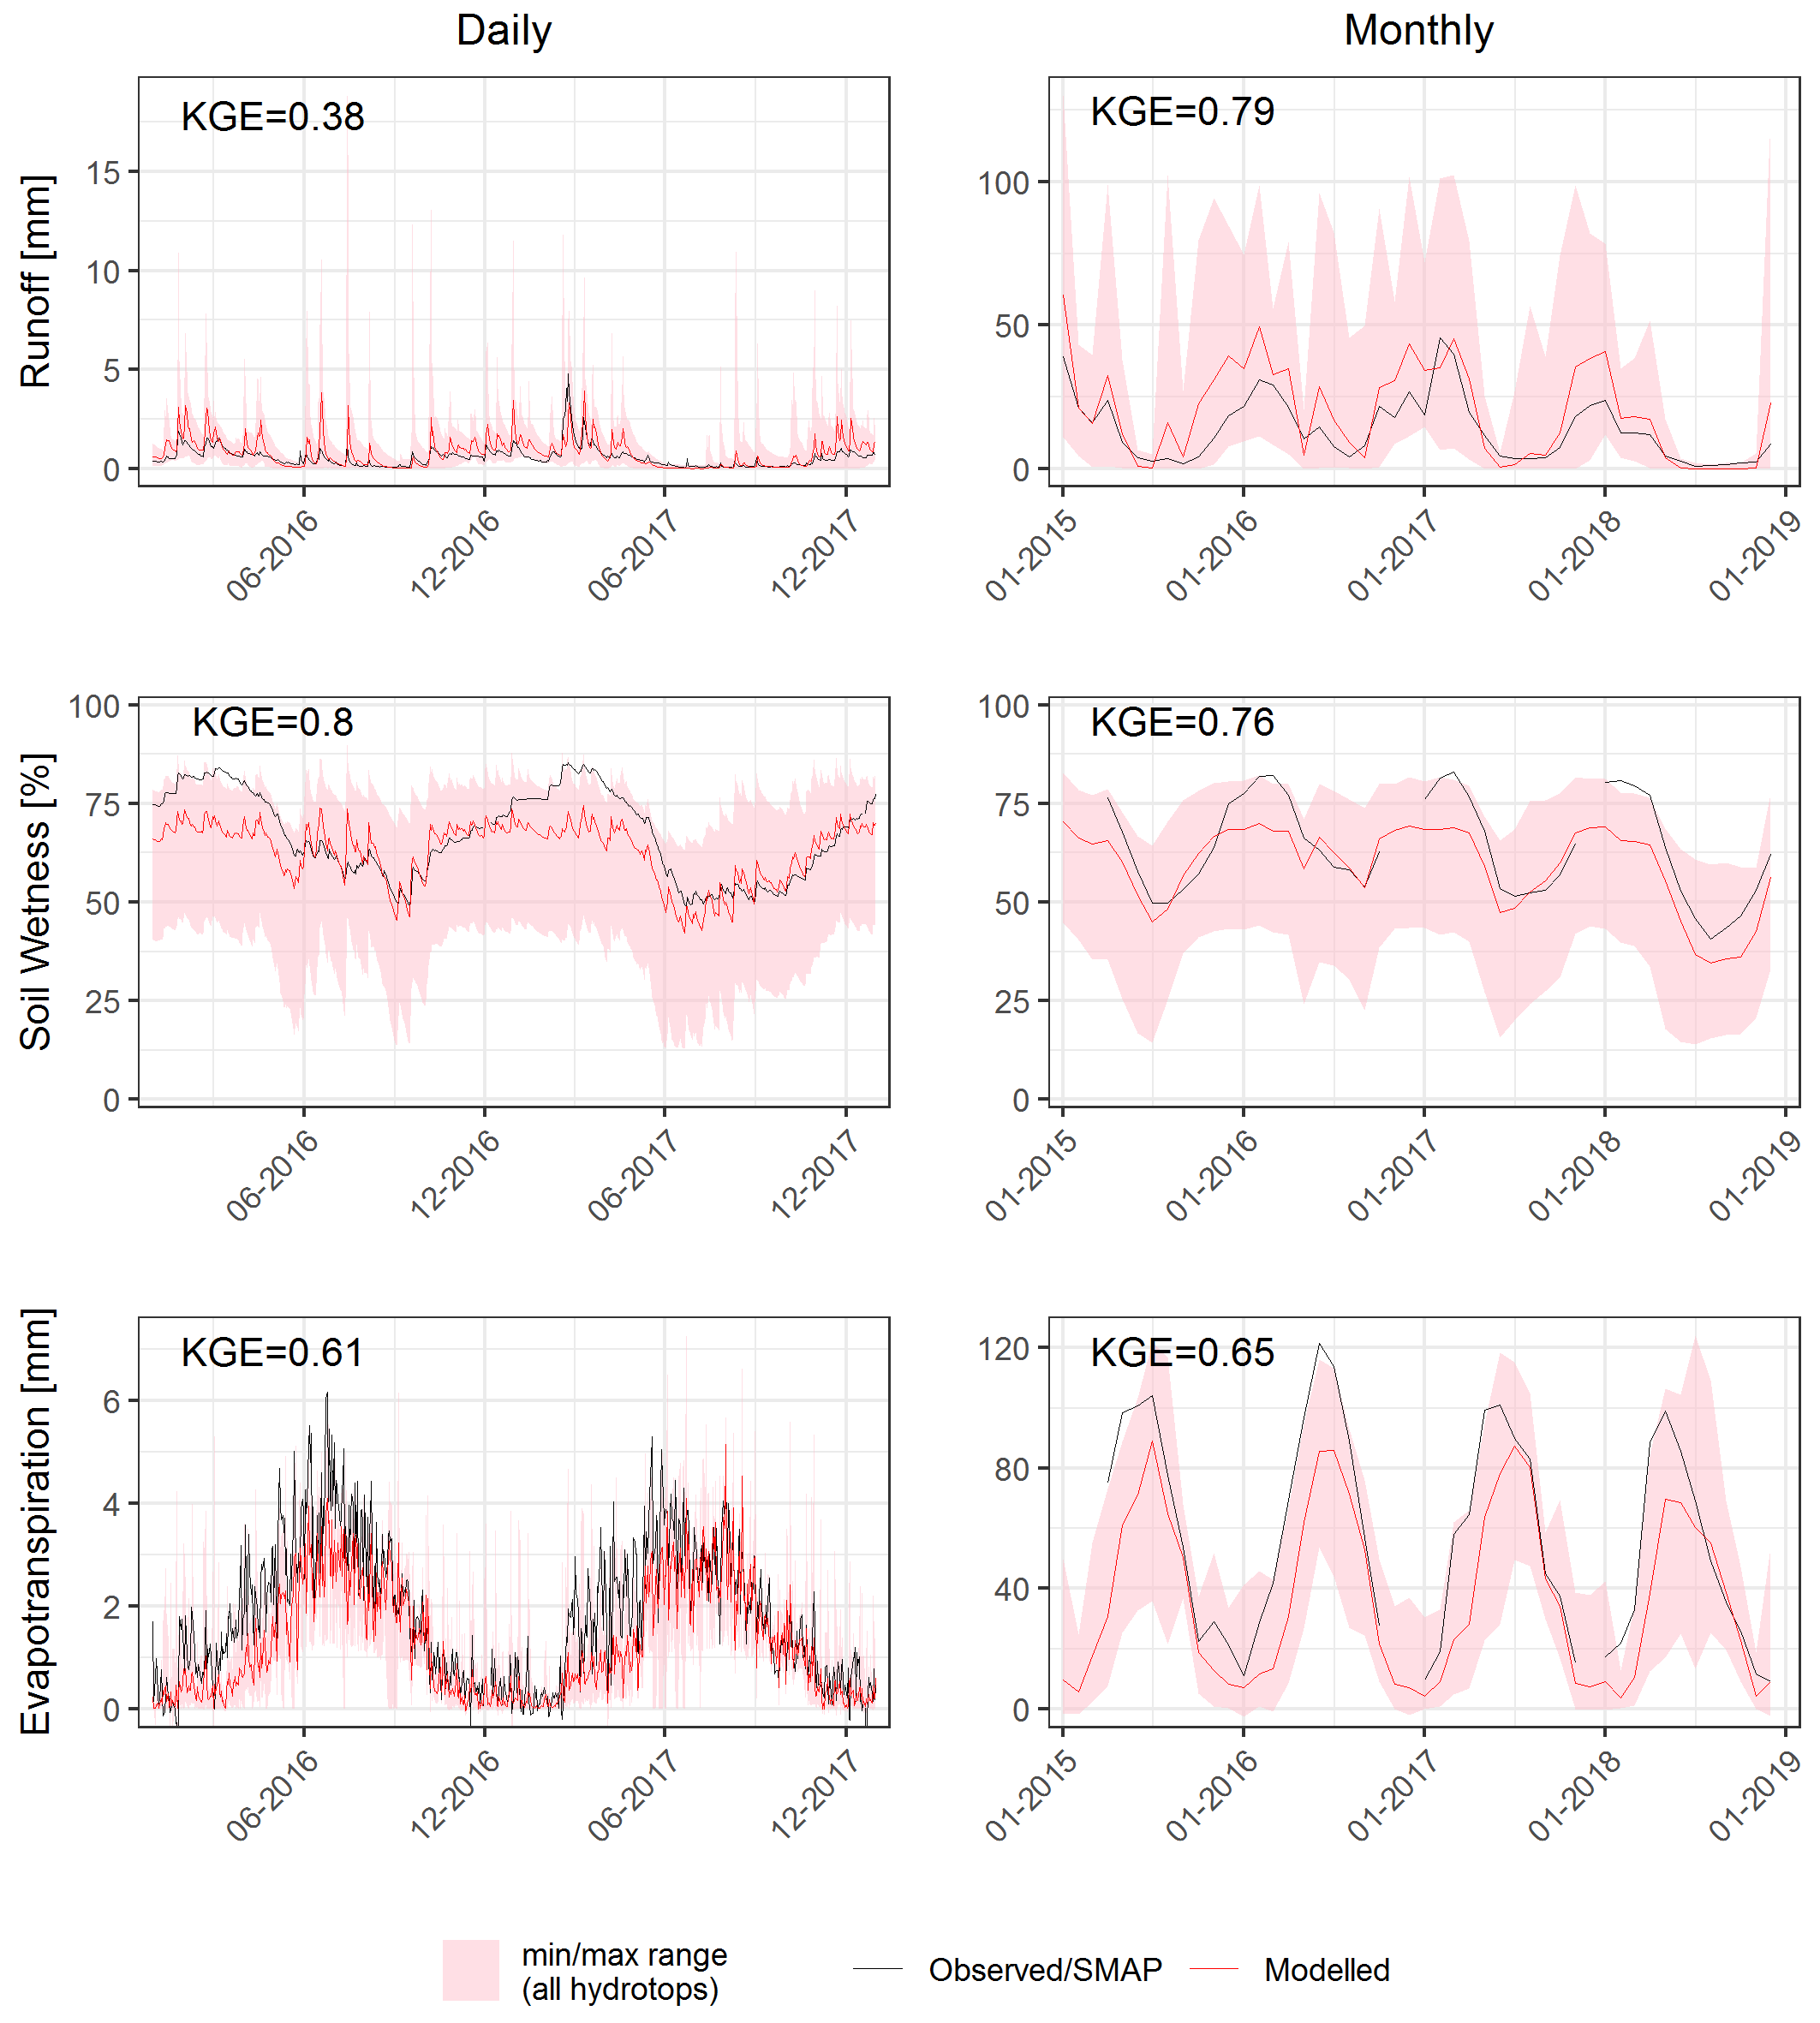
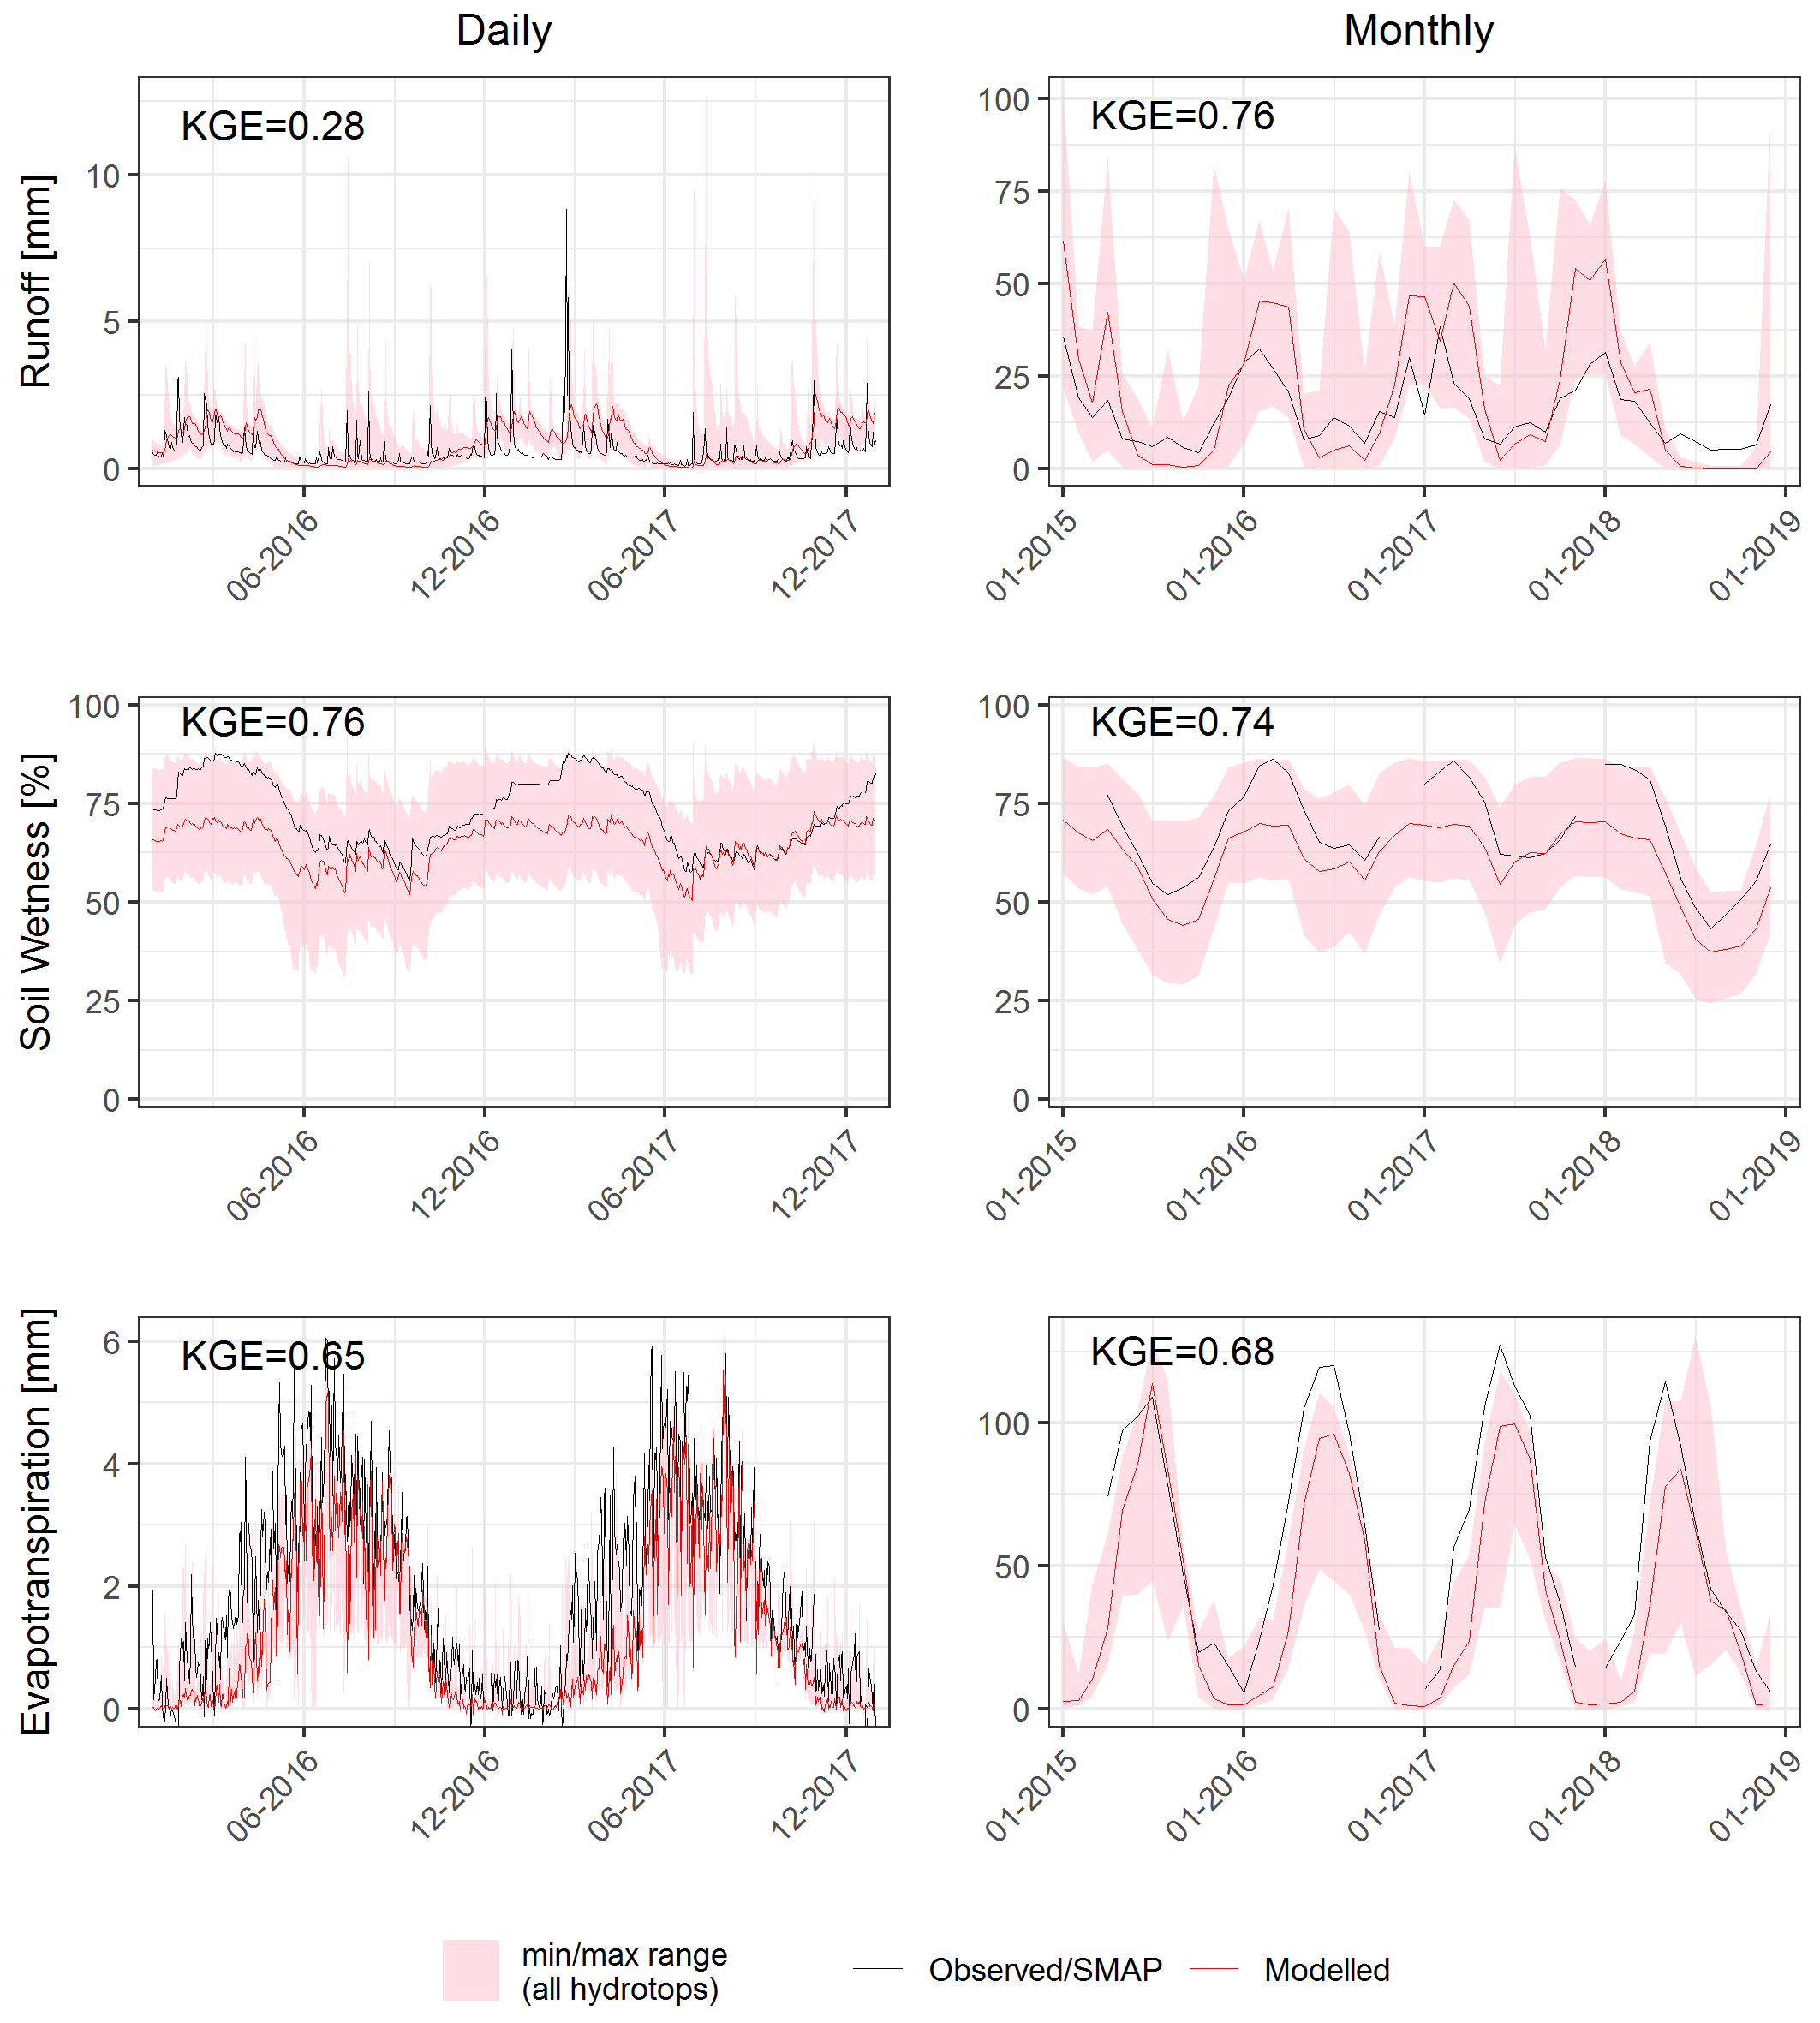
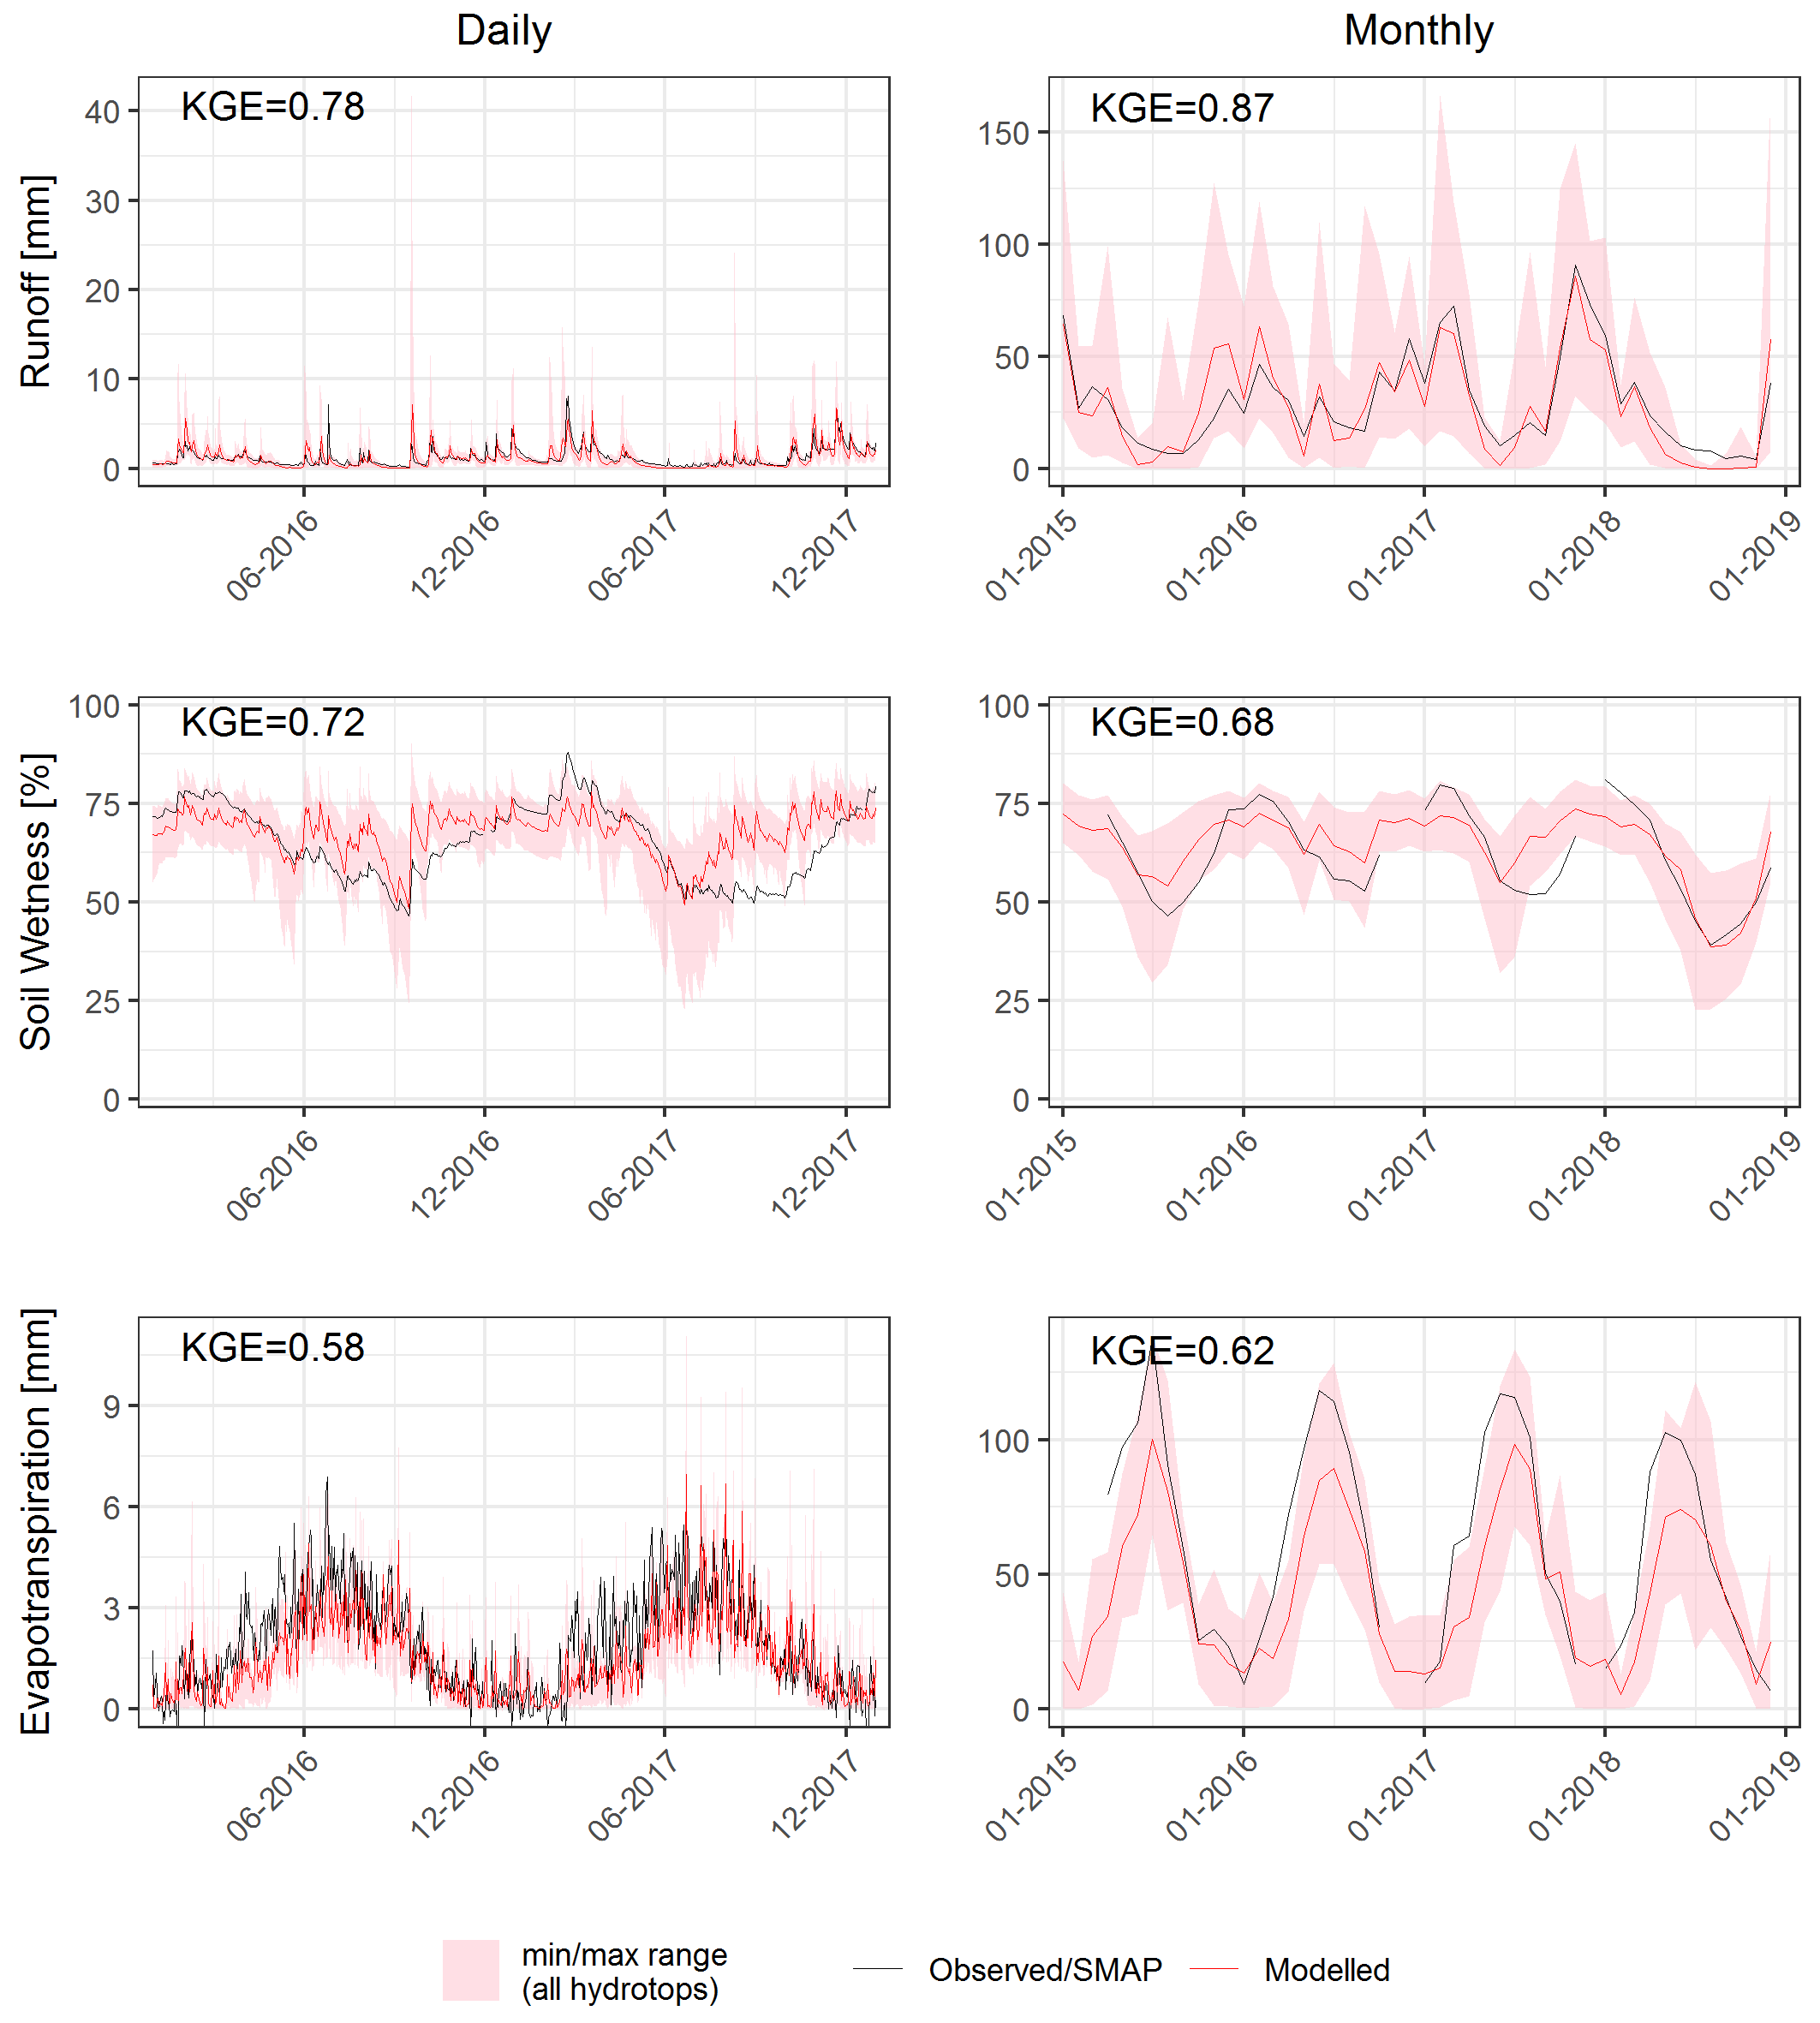
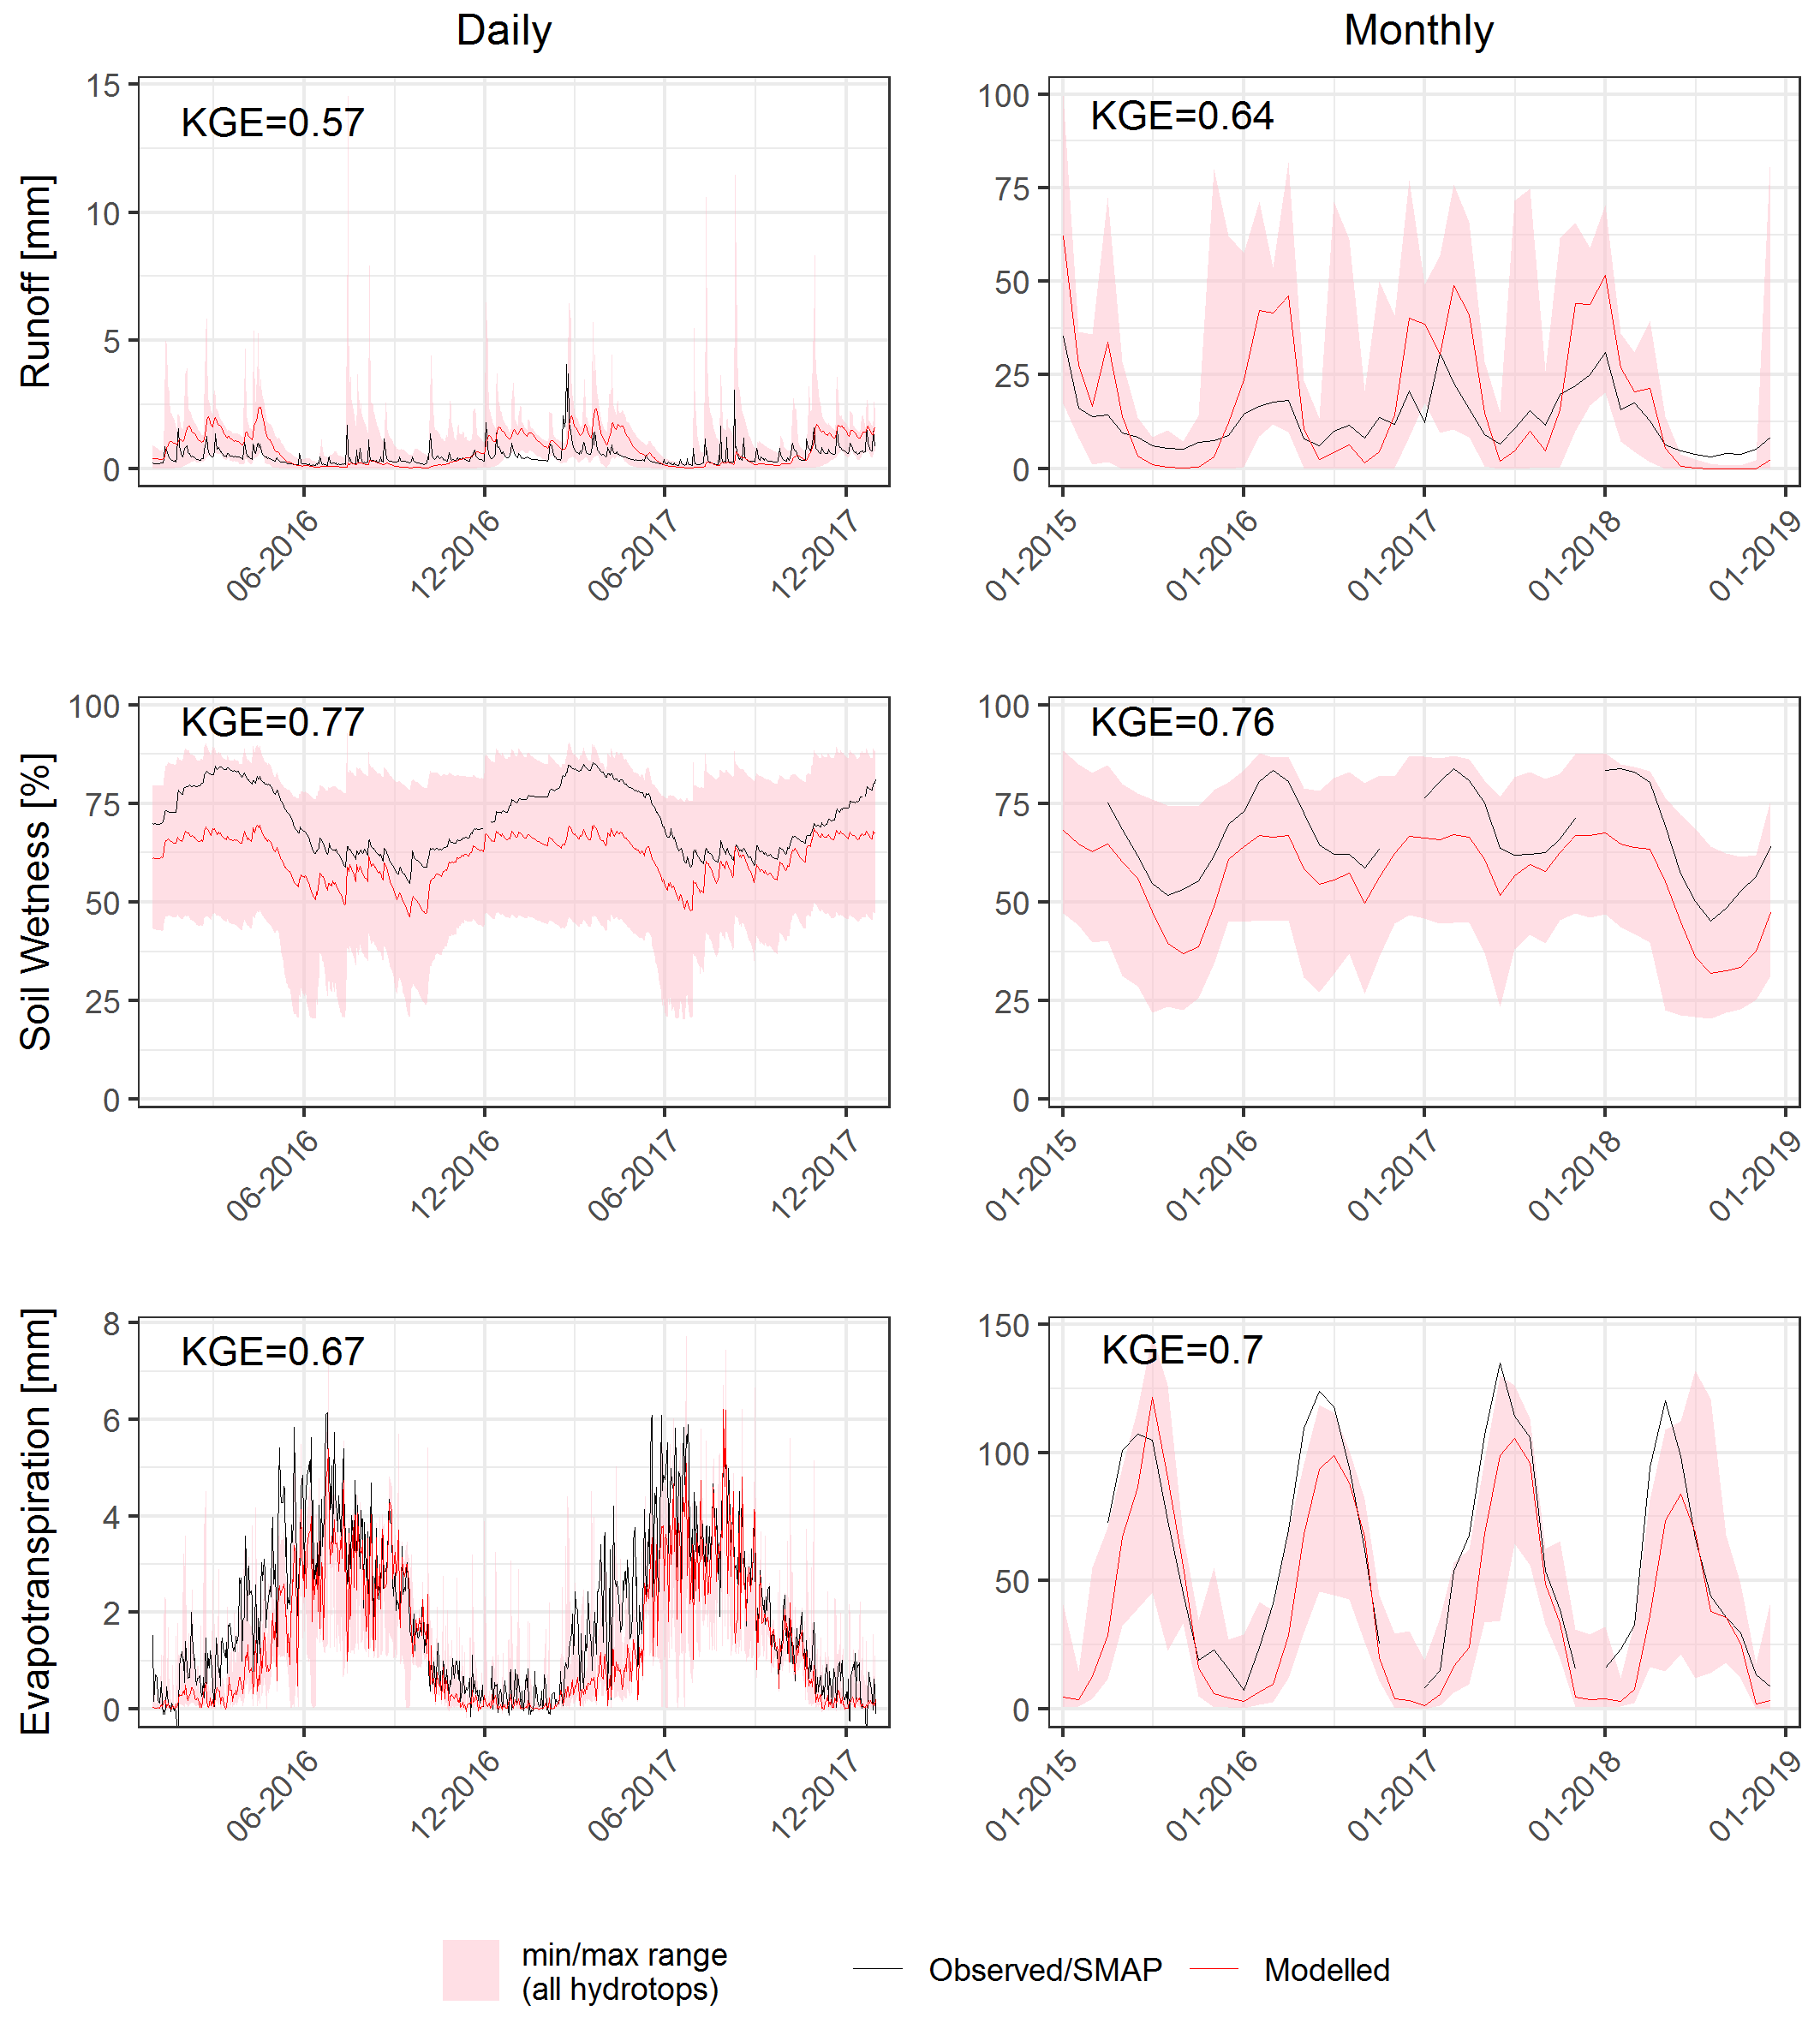
Figure S. 1-9: Daily and monthly time series of simulated (weighted mean and max/min range from all hydrotops) runoff, soil wetness and ET compared with observations for the selected catchment (IDs from 1-3 and 5-10).
Files
Grossschweidnitz_plot.png
Files
(1.3 MB)
| Name | Size | Download all |
|---|---|---|
|
md5:b79df4393fa021c44326bdfd46d0a060
|
123.0 kB | Preview Download |
|
md5:db706800078c6d3a9cdff2ba85bbb36f
|
123.9 kB | Preview Download |
|
md5:2ba610c118049557960a938ce26f2e68
|
127.1 kB | Preview Download |
|
md5:14c0c88f48e673824365bf3214c5927c
|
128.2 kB | Preview Download |
|
md5:228baf28d790fbb475bc8fb843163503
|
127.9 kB | Preview Download |
|
md5:3217f755eb36b7122ea53bc99d4ac567
|
127.2 kB | Preview Download |
|
md5:db2e2e6d24d8c37a4e40291cd14e3770
|
124.9 kB | Preview Download |
|
md5:c528a48c03347399b7c6cccdd1e5c385
|
127.3 kB | Preview Download |
|
md5:f4d120616527e8103bc1e1f4ffed3749
|
126.0 kB | Preview Download |
|
md5:e75ab6e7966fb0248769522b57263ee9
|
124.6 kB | Preview Download |