δ2Hn-alkane and δ18Osugar biomarker proxies from leaves and topsoils of the Bale Mountains, Ethiopia, and implication for paleoclimate reconstruction
Creators

- 1. Institute of Agronomy and Nutritional Sciences, Soil Biogeochemistry, Martin Luther University Halle-Wittenberg, Von-Seckendorff-Platz 3, D-06120, Halle, Germany
- 2. Institute of Geography, Technische Universität Dresden, Helmholtzstraße 10, D-01062, Dresden, Germany
- 3. Center for Water Resources Research, School of Agricultural, Earth and Environmental Sciences, University of KwaZulu-Natal, Pietermaritzburg 3021, South Africa,
- 4. Department of Plant Biology and Biodiversity Management, Addis Ababa University, P.O. Box 3434, Addis Ababa, Ethiopia
- 5. Institute of Soil Science and Soil Geography, University of Bayreuth, Universitätsstraße 30, D-95440, Bayreuth, Germany
Description
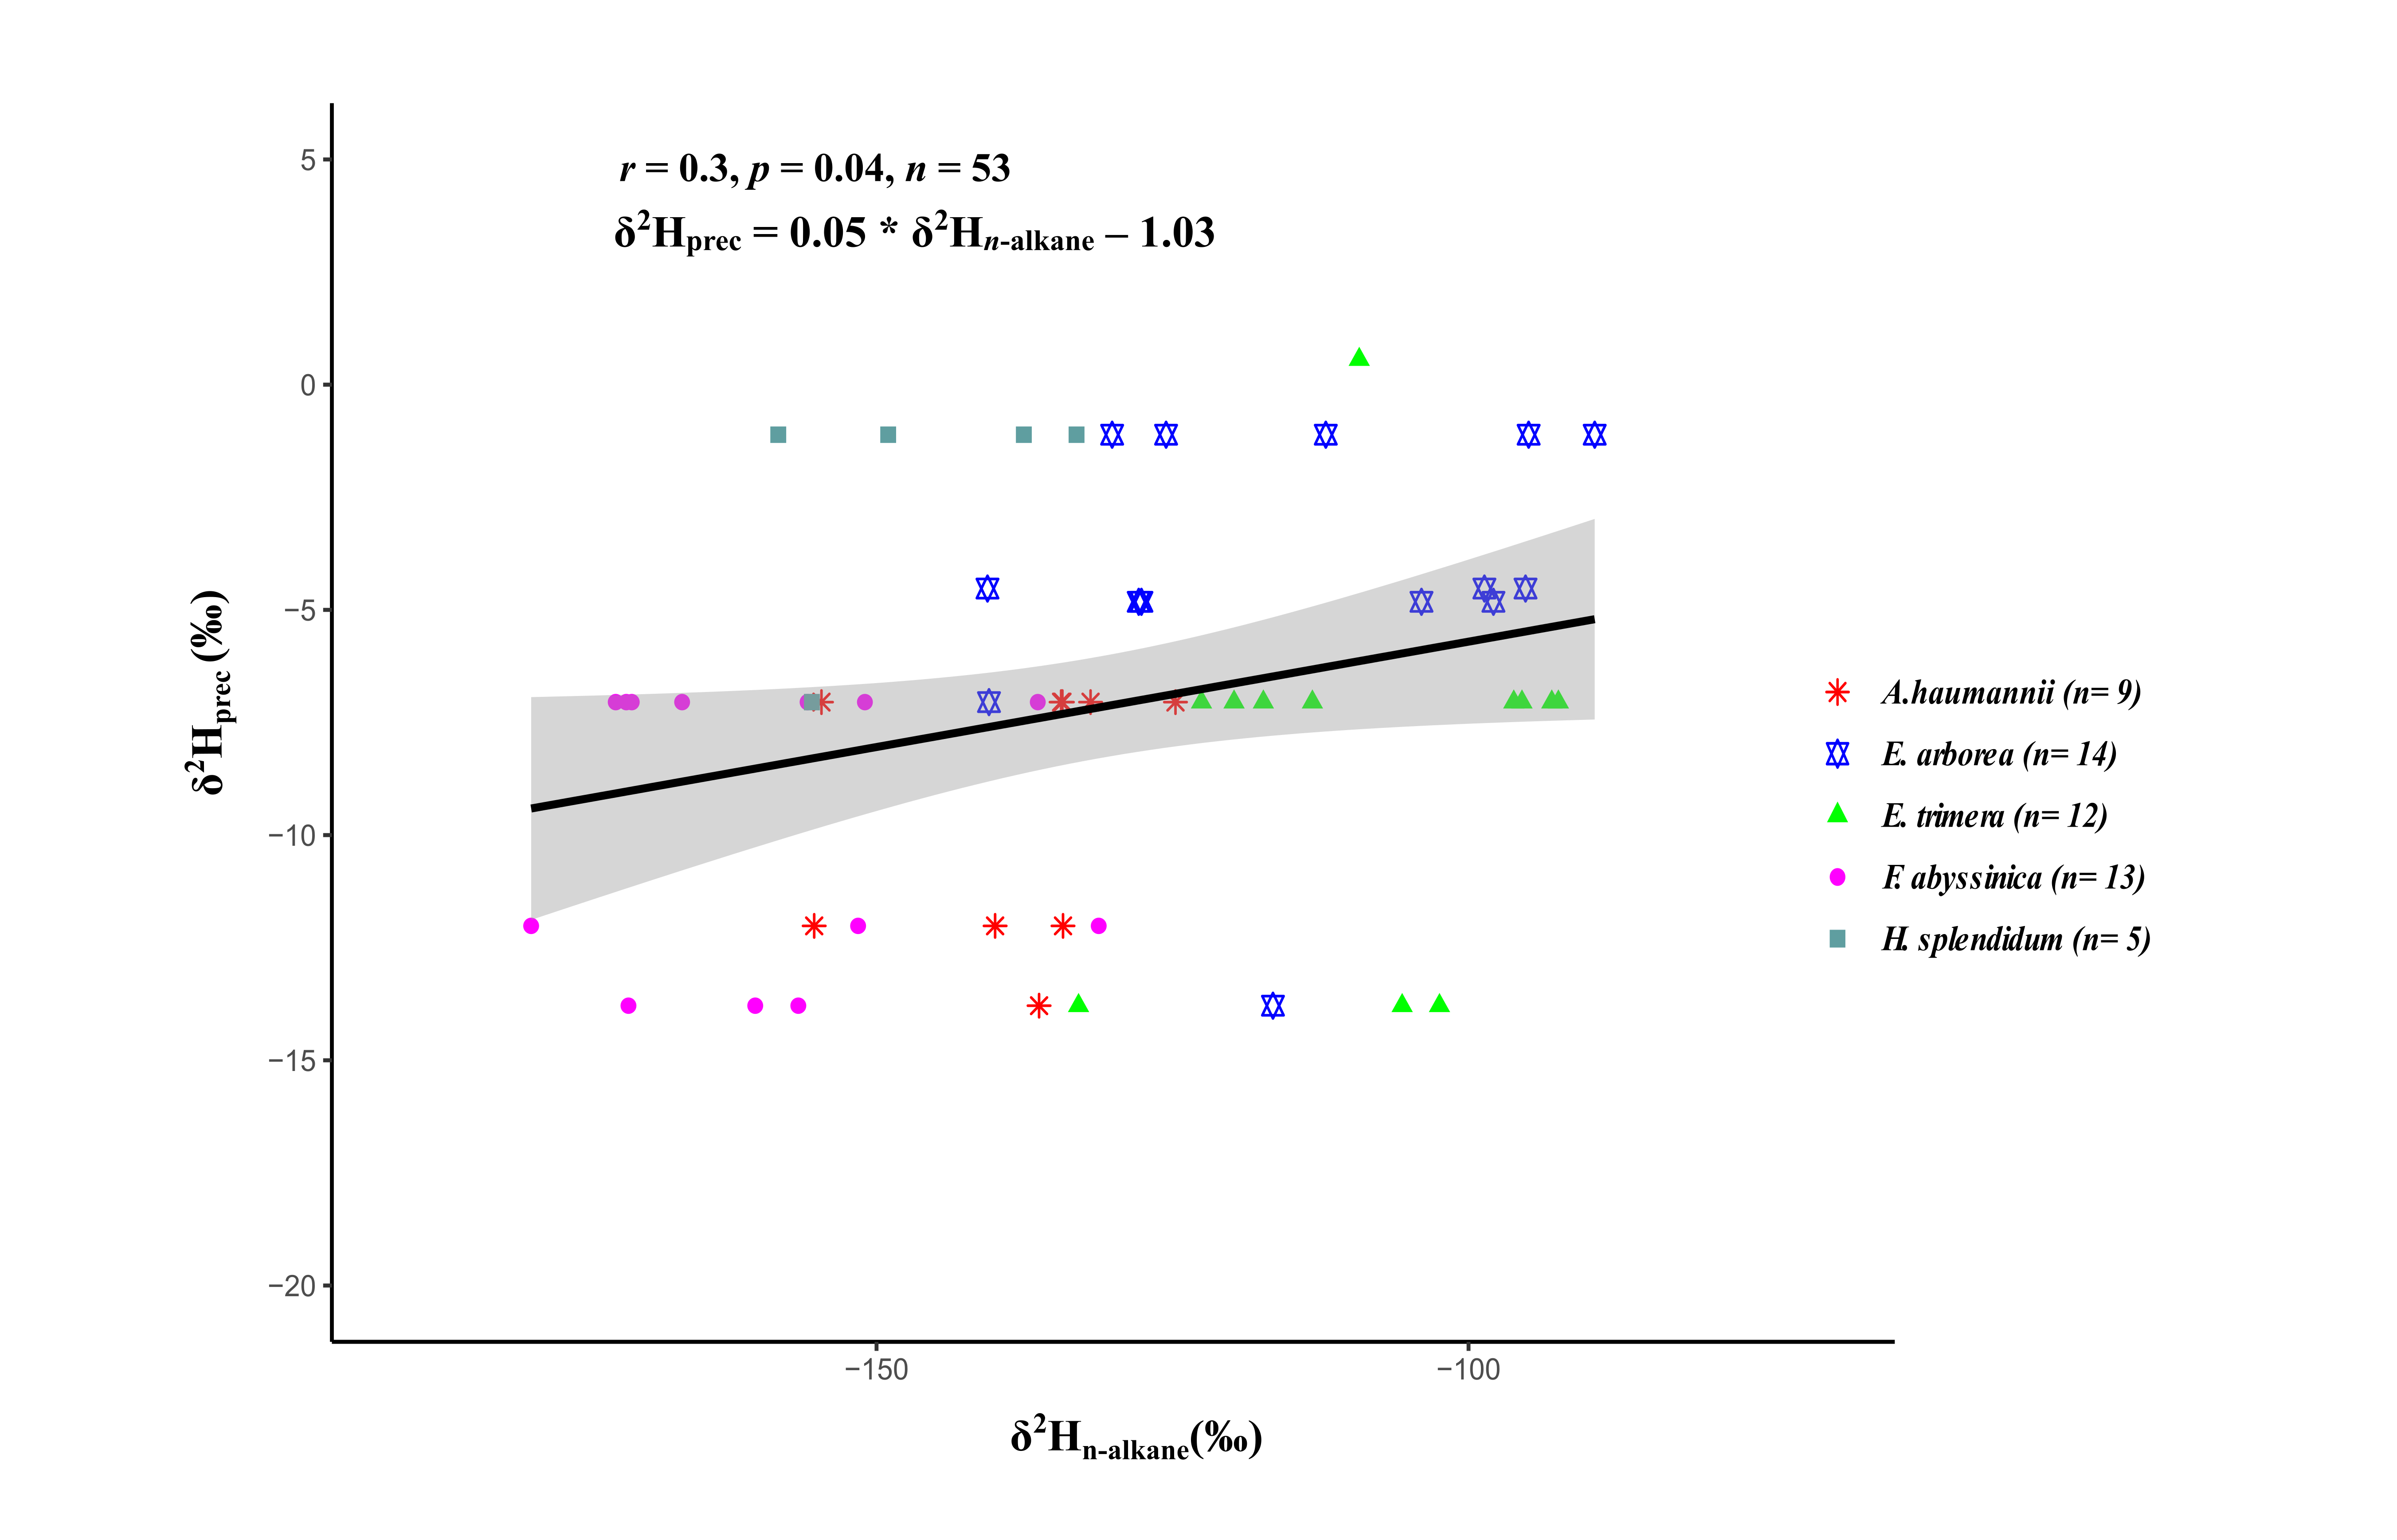
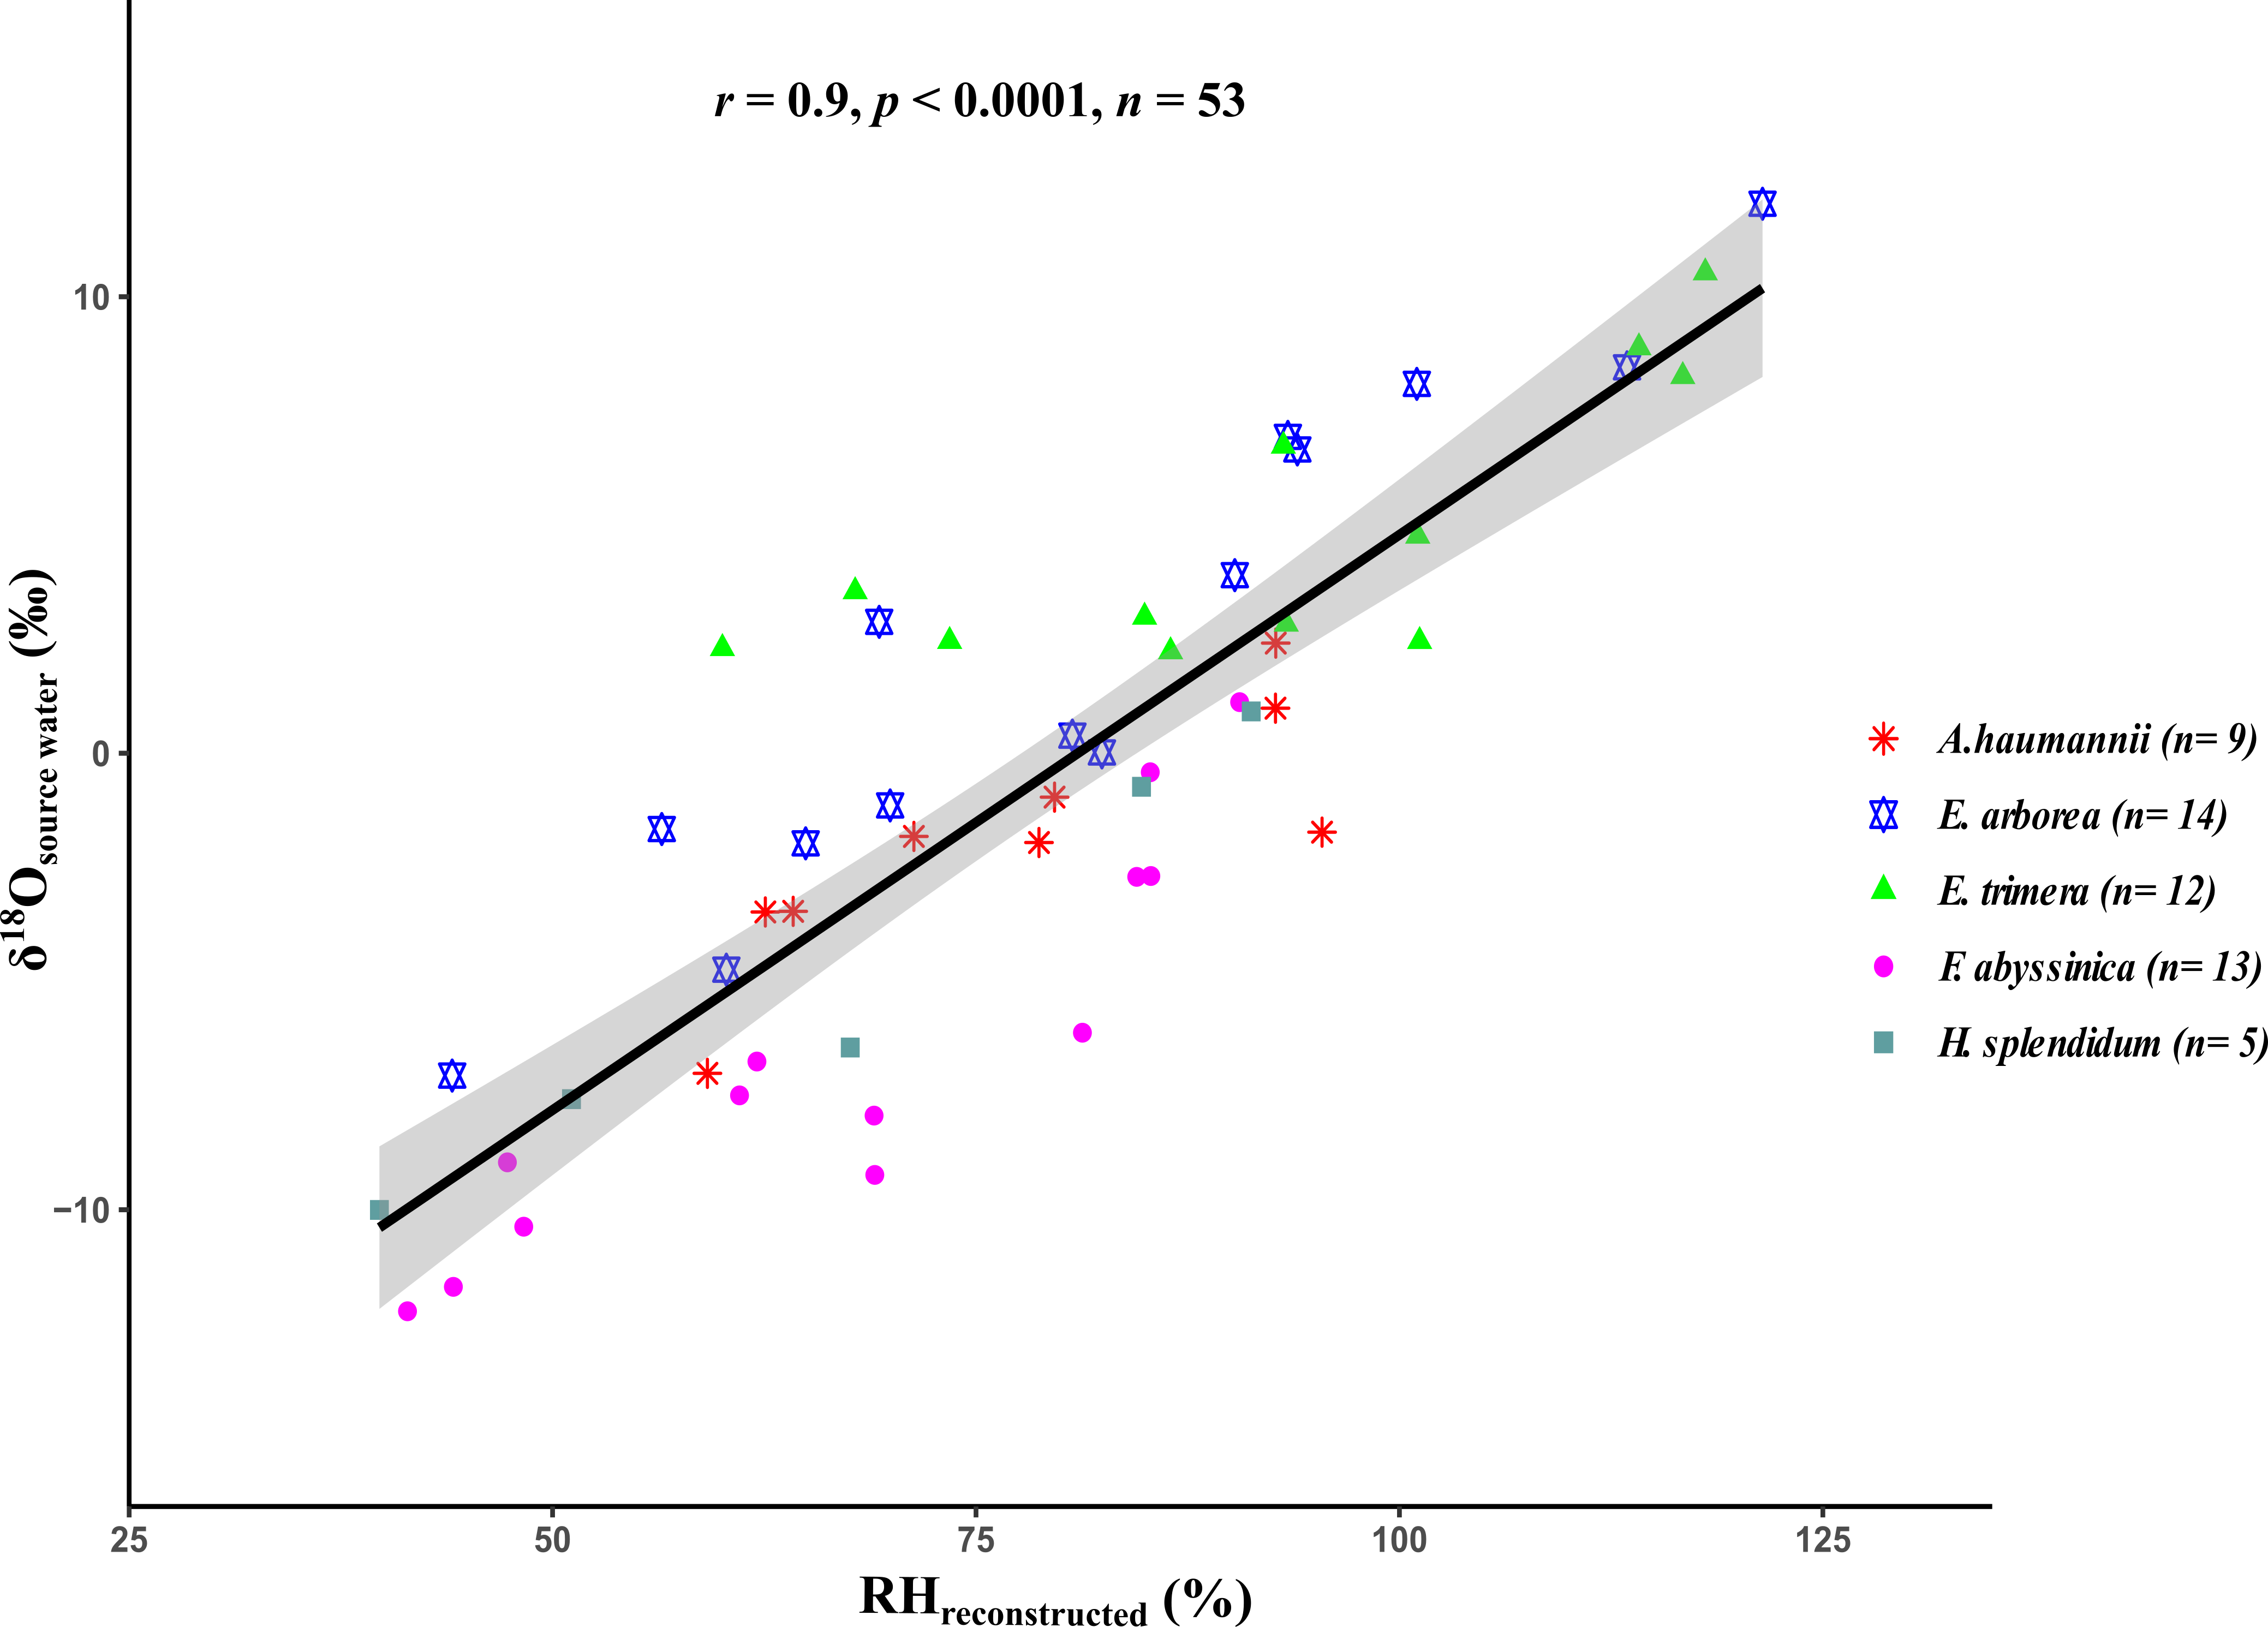
ESM_1: A scatter plot shows the correlations between n-C31 and n-C29 alkanes. The linear regression lines (black line), correlation coefficients (r), 95% confidence intervals (grey area), and significance values (p) are provided. ESM_2: A scatter plot shows the correlations between xylose and arabinose sugars. The linear regression lines (black line), correlation coefficients (r), 95% confidence intervals (grey area), and significance values (p) are provided. ESM_3: A scatter plot shows the correlations between δ2Hn-alkane and δ2Hprec. The linear regression lines (black line), regression equation, correlation coefficients (r), 95% confidence intervals (grey area), and significance values (p) are provided. ESM_4: A scatter plot shows the correlations between reconstructed RH and δ18Oleaf water. The linear regression lines (black line), regression equation, correlation coefficients (r), 95% confidence intervals (grey area), and significance values (p) are provided. ESM_5: A scatter plot shows the correlations between reconstructed RH and δ2Hleaf water. The linear regression lines (black line), regression equation, correlation coefficients (r), 95% confidence intervals (grey area), and significance values (p) are provided. ESM_6: A scatter plot shows the correlations between reconstructed RH and δ2Hsource water. The linear regression lines (black line), regression equation, correlation coefficients (r), 95% confidence intervals (grey area), and significance values (p) are provided.ESM_7: A scatter plot shows the correlations between reconstructed RH and δ18Osource water. The linear regression lines (black line), regression equation, correlation coefficients (r), 95% confidence intervals (grey area), and significance values (p) are provided.:ESM_8: A complete dataset (sheet 1) and records of isotopes in precipitation (sheet 2).
Files
ESM_1.png
Files
(2.7 MB)
| Name | Size | Download all |
|---|---|---|
|
md5:61fb01f71249933ab2ef2cf759817eb7
|
458.9 kB | Preview Download |
|
md5:f20b90cc45a8addbdedcf1d01938fbff
|
416.1 kB | Preview Download |
|
md5:f34187a73597bb2c3f96f62f3d0b3d10
|
345.2 kB | Preview Download |
|
md5:3c68596112f079eebd64bb8de34c8f29
|
365.4 kB | Preview Download |
|
md5:1439edf33360eb957a97e904a62da699
|
363.9 kB | Preview Download |
|
md5:da7ce30dddcbb67f708d55a3c59b11b2
|
367.7 kB | Preview Download |
|
md5:f2333540bba40ebdaf6de70763f073cb
|
378.9 kB | Preview Download |
|
md5:ccbe7dea4355955411f168db2f87a0d6
|
52.4 kB | Download |