Housing Boom and Bust: The Case of DC Rental Market
Creators
Description
This project uses Zillow publicly released data to show the trends of the rental housing market in Washington D.C. The project primarily looks at market trends after the 2008 recession.
Rental Price by State- This visualization shows the rental price by state. The graph shows all 50 states and DC ranked in ascending order by the average rental price in that state.
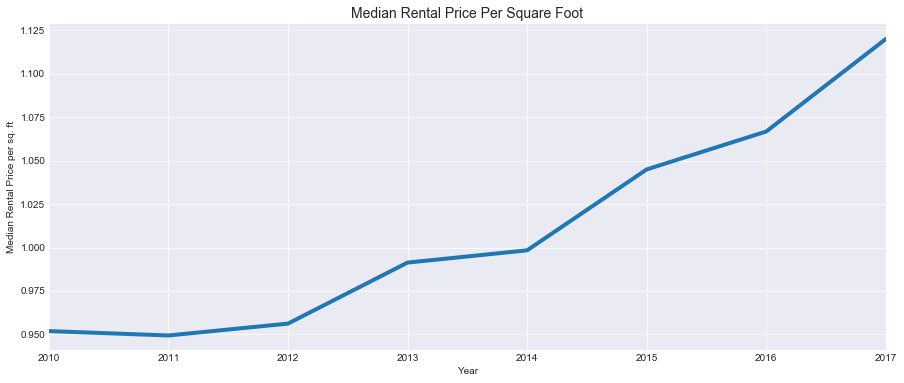
Median Rental Price Per Square Foot- This visualization shows the median renal price per square foot. This graph shows the national median rental price per square foot by the years available after the housing bust.
Median Rental Price Per Square Foot1- This visualization shows the median renal price per square foot. This graph shows DC's median rental price per square foot by the year after the housing bust.
DC Rental Price- This visualization shows DC's Median Rental Price. This graph shows the Median Rental Price by year for the years after the available housing bust.
Files
DC Rental Price.png
Files
(47.2 MB)
| Name | Size | Download all |
|---|---|---|
|
md5:2d252f9fcc0b81d7aa16096af8d83833
|
20.8 kB | Preview Download |
|
md5:fe21f7721c3155903694ff245f60f6a6
|
376.7 kB | Download |
|
md5:ebce5950fb7e2abea1f3304988a5ade7
|
41.9 MB | Preview Download |
|
md5:afcf28a6e2ed468d68c5a570ecc4baa2
|
27.4 kB | Preview Download |
|
md5:c0b4200a0cb9886f19c5a0ca6e94adea
|
25.4 kB | Preview Download |
|
md5:7aa4c7ff2ed41eb3993a4a389c80f3c1
|
50.8 kB | Preview Download |
|
md5:d3b489c7944113343ad323b415b0cf6b
|
4.7 MB | Preview Download |