Table 5: Model Fit Summary (b) for Grade Three
Description
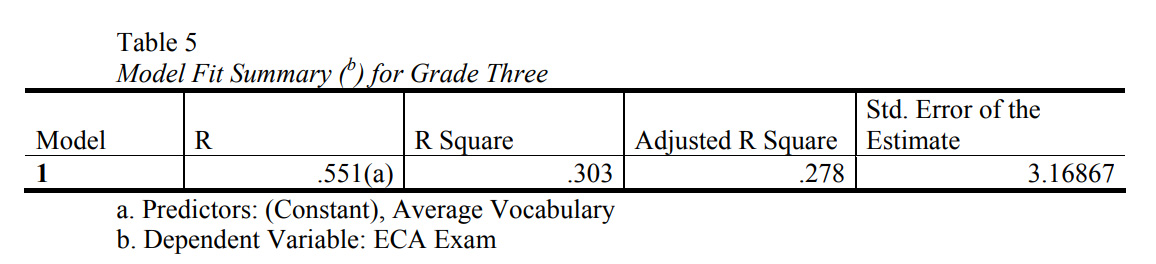
The model summary in Table 5 reports the strength of the relationship between the model and the
dependent variable, i.e., ECA exam. The multiple correlation coefficient, R, which is the linear
correlation between the observed and the model-predicted values of the dependent variable is .551.
R Square, which is also called the coefficient of determination, is .303 showing that approximately
30 percent of the variation in ECA exam is explained by the model. Its interpretation is that 30
percent of the variation in the ECA test scores is common with the vocabulary scores. The Standard
Error of the Estimate of the model is approximately 3.16 out of a total of 30, meaning that the
prediction model produces an error range between ± [3.16]. Therefore, the prediction formula must
be rewritten as (AVERAGE VOCAB × 0.713) + 2.871± [3.16].
Notes
Files
Model Fit Summary (b.jpg
Files
(92.6 kB)
| Name | Size | Download all |
|---|---|---|
|
md5:3361493b229342e283c8ead8e9a71f7e
|
92.6 kB | Preview Download |