Published October 15, 2010
| Version v1
Figure
Open
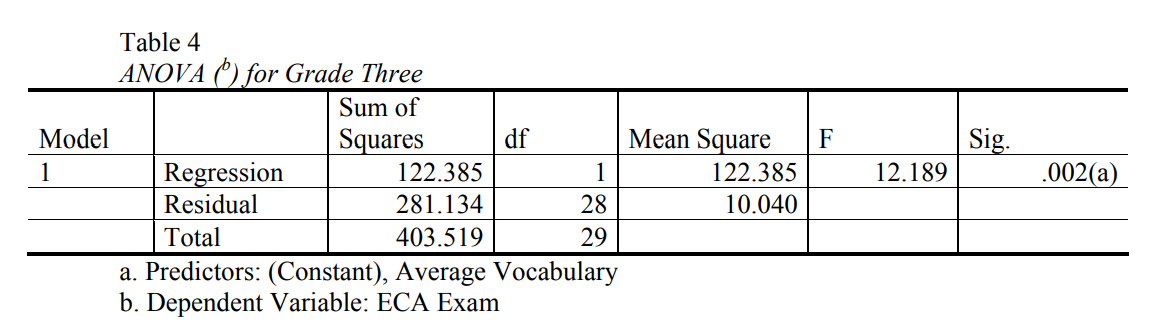
Table 4: ANOVA (b) for Grade Three
Description
The ANOVA table below (Table 4) tests the acceptability of the model from a statistical
perspective. The amount of regression sums of squares is122.385 indicating that about 33 percent of
the total variation is explained by the model and the amount of residual sums of squares is 281.134
showing that about 67 percent of the variation is due to some factors other than the average
vocabulary variable. The significance value of the F statistic is less than 0.05, which means that the
variation explained by the model is not due to chance.
Notes
Files
ANOVA (b.jpg
Files
(107.0 kB)
| Name | Size | Download all |
|---|---|---|
|
md5:cfd519e2c69dae3019986a525a9899a2
|
107.0 kB | Preview Download |