Supporting Information for "New 3D velocity model (mTAB3D) for absolute hypocenter location in southern Iberia and the westernmost Mediterranean"
Creators

- 1. Complutense University of Madrid
- 2. Universidad Complutense de Madrid
- 3. Complutense University of Madrid (UCM)
- 4. Geosciences Barcelona (GEO3BCN-CSIC)
- 5. Institut de Ciències del Mar (CSIC)
- 6. Spanish Seismic Network, Instituto Geográfico Nacional (IGN)
Description
These files comprise supplementary information for the paper entitled "New 3D velocity model (mTAB3D) for absolute hypocenter location in southern Iberia and the westernmost Mediterranean" (Sánchez-Roldán et al., 2024a)
These results were obtained after performing a relocation using the 3D P-wave velocity model mTAB3D (Sánchez-Roldán et al. 2024b).
In "Files.zip", we provide the eight files with the absolute locations and the uncertainty parameters (extracted from the 68% confidence ellipse of the PDF’s) obtained after performing the relocation using mIGN1D and mTAB3D. The absolute location files follow this format:
origin_time(YYYY-mm-ddTHH:MM:SS) longitude(º) latitude(º) depth(km) magnitude(mbLg)
• origin_time: Hypocenter’s origin time after the relocation.
• longitude: Hypocenter’s longitude in decimal degrees after the relocation.
• latitude: Hypocenter’s latitude in decimal degrees after the relocation.
• depth: Hypocenter’s depth in kilometers.
• magnitude: Hypocenter’s magnitude (mbLg) computed by the Spanish Seismic Network.
The files with the uncertainty values:
horizontal_uncertainty(km) vertical_uncertainty(km) rms(s) no_arrivals
• horizontal_uncertainty: Obtained after computing the geometrical mean between the horizontal semi-minor and semi-major axes of the 68% confidence ellipse in kilometers.
• vertical_uncertainty: Vertical semi-axis of the 68% confidence ellipse.
• rms: root-mean-square of residuals at maximum likelihood or expectation hypocenter.
• no_arrivals: number of readings used for the absolute location.
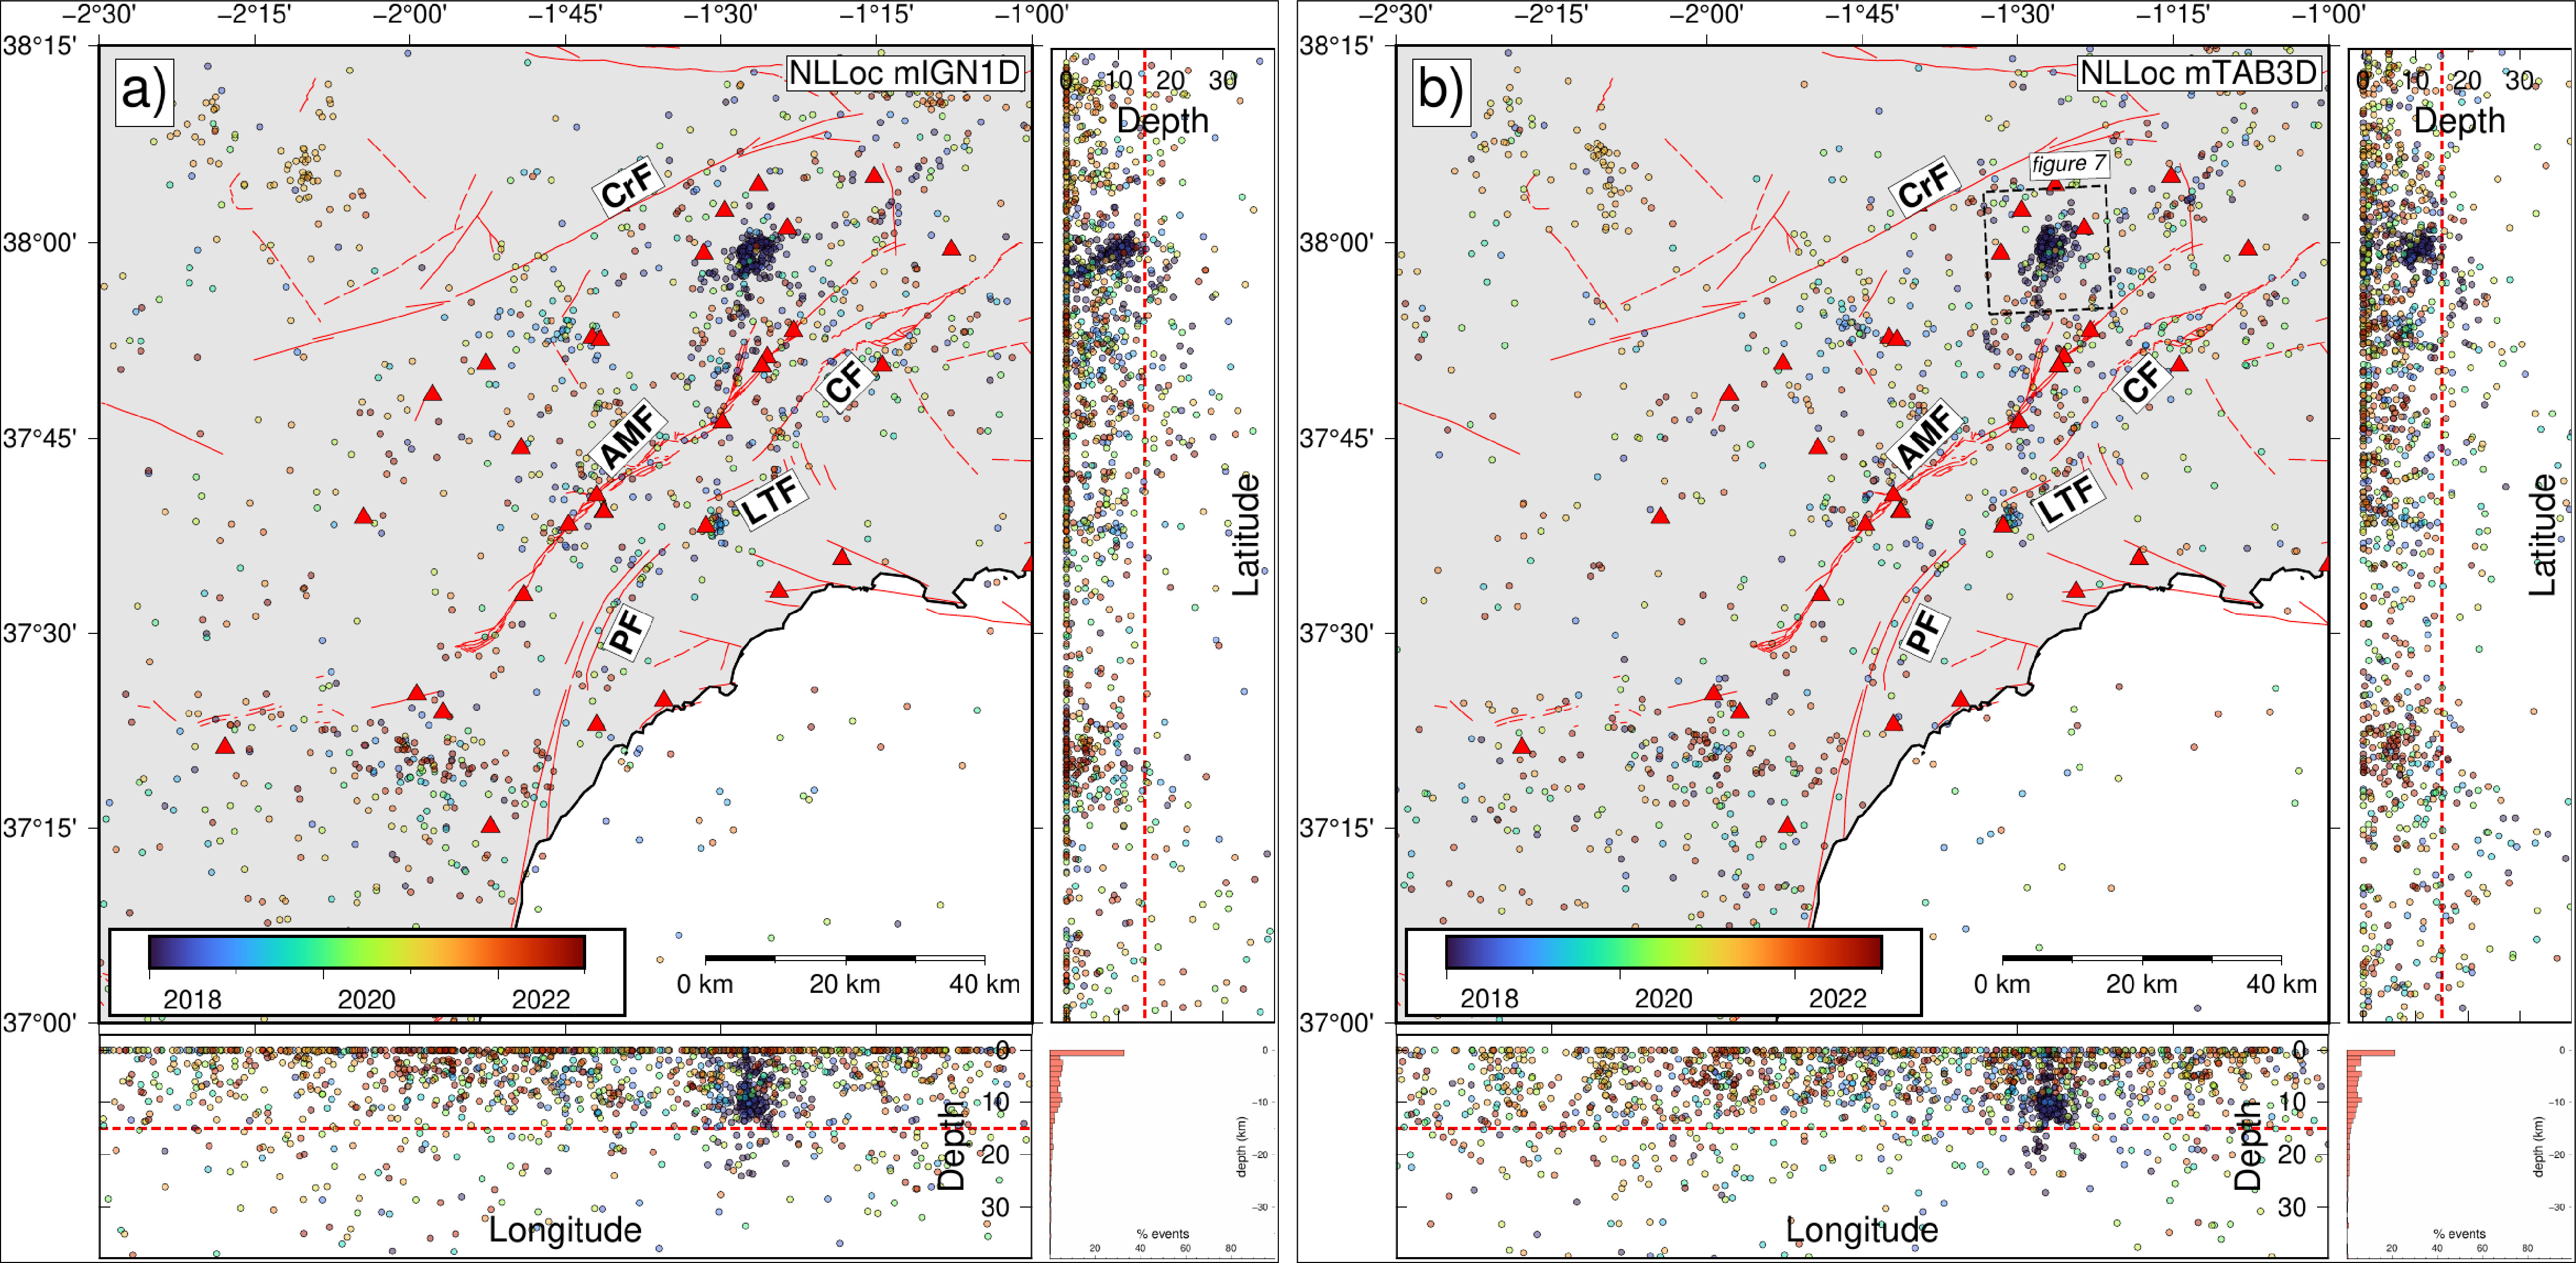
File S1. File_S1.dat: Eastern Betics Shear Zone catalog’s absolute locations with mIGN1D.
File S2. File_S2.dat: Eastern Betics Shear Zone catalog’s statistics with mIGN1D.
File S3. File_S3.dat: Eastern Betics Shear Zone catalog’s absolute locations with mTAB3D.
File S4. File_S4.dat: Eastern Betics Shear Zone catalog’s statistics with mTAB3D.
File S5. File_S5.dat: Al Hoceima 2016 catalog’s absolute locations with mIGN1D.
File S6. File_S6.dat: Al Hoceima 2016 catalog’s statistics with mIGN1D.
File S7. File_S7.dat: Al Hoceima 2016 catalog’s absolute locations with mTAB3D.
File S8. File_S8.dat: Al Hoceima 2016 catalog’s statistics with mTAB3D.
Additionally, we provide two figures showing the location of those hypocenters (alboran.jpg and ebsz.jpg), which are included as Figures 3 and 5, respectively, in Sánchez-Roldán et al. (2024a).
References:
Sánchez-Roldán, J. L., Álvarez-Gómez, J. A., Martínez-Díaz, J. J., Herrero-Barbero, P., Perea, H., Cantavella, J. V., & Lozano, L. (2024a). New 3D velocity model (mTAB3D) for absolute hypocenter location in southern Iberia and the westernmost mediterranean. Earth and Space Science, 11, e2023EA00299. https://doi.org/10.1029/2023EA002993
Sánchez-Roldán, J. L., Álvarez-Gómez, J. A., Martínez-Díaz, J. J., Herrero-Barbero, P., Perea, H., Lozano, L., & Cantavella, J. V. (2024b). MTAB3D: a 3-D velocity model for absolute hypocenter location in southern Iberia and westernmost Mediterranean. (v1.0) [Data set]. Zenodo. https://doi.org/10.5281/zenodo.7766525
Files
alboran.jpg
Additional details
Related works
- References
- Model: 10.5281/zenodo.7766525 (DOI)
References
- Sánchez-Roldán, J. L., Álvarez-Gómez, J. A., Martínez-Díaz, J. J., Herrero-Barbero, P., Perea, H., Cantavella, J. V., & Lozano, L. (2024). New 3D velocity model (mTAB3D) for absolute hypocenter location in southern Iberia and the westernmost mediterranean. Earth and Space Science, 11, e2023EA002993. https://doi.org/10.1029/2023EA002993