Published September 26, 2018
| Version v1
Figure
Open
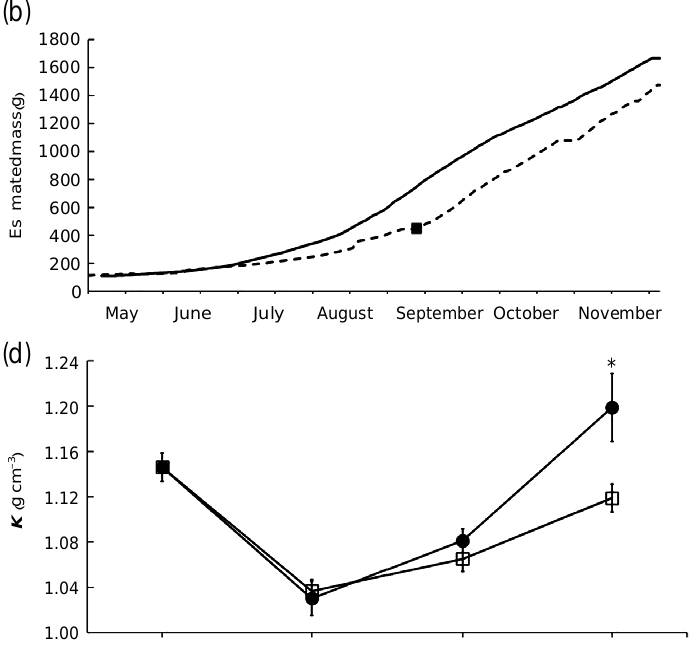
FIGURE 3 in Comparison between Atlantic salmon Salmo salar post-smolts reared in open sea cages and in the Preline raceway semi-closed containment aquaculture system
Creators
- 1. Uni Research Environment, Uni Research AS, Bergen, Norway
- 2. Faculty of Fisheries Sciences, Hokkaido University, Hakodate, Japan
- 3. LerØy Seafood Group ASA, Bergen, Norway
- 4. Department of Biology, University of Bergen, Bergen, Norway
Description
FIGURE 3 Mean [S.E.; n = 30; (a), (c), (d)] Salmo salar growth in mass (M) fork length (LF) and Fulton's condition factor (K) measured in freshwater (15 April 2016) and during the post-smolt phase (1–2 June; 1–2 June and 29–30 August 2016) (a) Measured mass () Preline, and () Reference, (b) estimated mean mass (Fishtalk calculations, CEF = 1.1) () Reference, and () Preline, (c) mean fork length () Preline, and () Reference and (d) condition factor (K) () Preline, and () Reference. Estimated mean mass covers both the post-smolt phase 5 May to 30 August, and the growth phase 31 August to 30 November. Changeover is indicated with a dot in the figure. SW, seawater. Significant difference between groups; *p <0.05; ***p <0.001
Notes
Files
figure.png
Files
(45.7 kB)
| Name | Size | Download all |
|---|---|---|
|
md5:3dad0f958c7cdb4ba97cbde422648ae5
|
45.7 kB | Preview Download |
Linked records
Additional details
Related works
- Is part of
- Journal article: 10.1111/jfb.13659 (DOI)
- Journal article: urn:lsid:plazi.org:pub:0901FF9FFF8FFFA0623AFB4FFFC3FFD2 (LSID)
- Journal article: https://zenodo.org/record/10928752 (URL)