Harvard Biomedical Research Data Lifecycle
Authors/Creators

-
1.
 Harvard Medical School
-
2.
Harvard University
Description
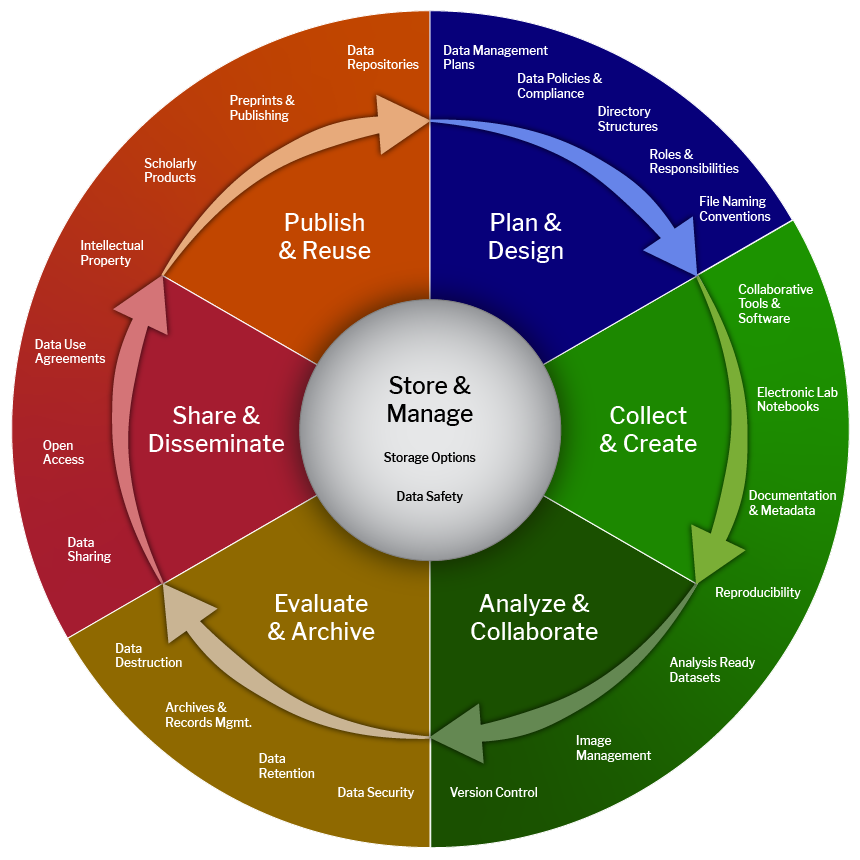
The Biomedical Data Lifecycle is a representation of stages in your research regarding data collection, use, and storage. At the core is how to "Store & Manage" the data for your project. How data is managed is integral to each stage in the diagram. Though the process is generally linear from "Plan & Design" to "Publish & Reuse," you may find yourself jumping around this lifecycle throughout your project. For example, "Data Management Plans" are created at the planning stage but will be used throughout the research process in subsequent stages. The plan dictates how you will handle the data collected and created, and how you will share and disseminate that data, all while considering data documentation, safety, and reuse.
This lifecycle diagram was created by the Harvard Longwood Medical Area Research Data Management Working Group.
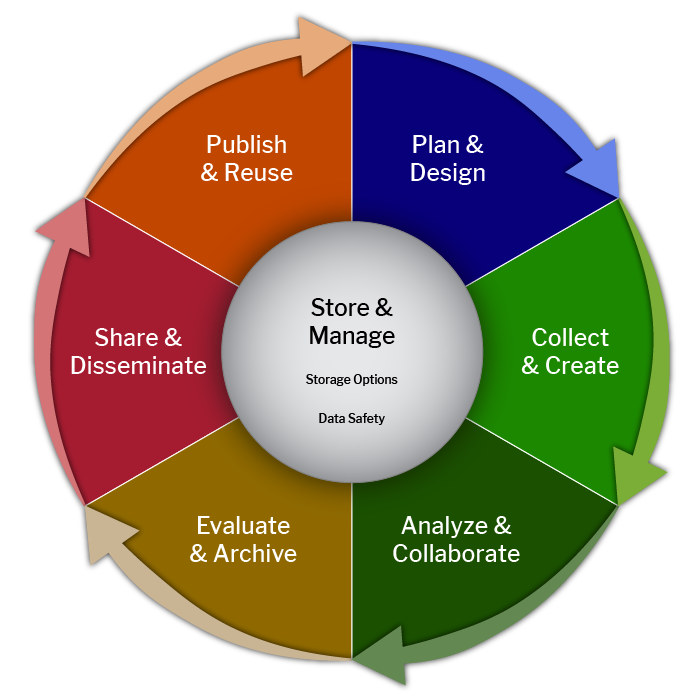
RDM-lifecycle-v5.png: This diagram depicts the core stages of the research lifecycle. The center of the wheel has a grey circle labeled "Store & Manage." The second layer is cut into six segments labeled "Plan & Design" in dark blue, "Collect & Create" in light green, "Analyze & Collaborate" in dark green, "Evaluate & Archive" in gold, "Share & Disseminate" in red, and "Publish & Reuse" in orange. Guiding arrows are at the edge of each segment, showing the process to be continuous like a wheel. In this version, all segment labels are in title case, and the "Evaluate & Archive" segment has been updated to gold to increase accessibility.
RDM-lifecycle-2tier-v5.png: This diagram includes an outer layer that represents the processes and concepts integral to each stage. The third layer expands the colors of each of the six sections and includes sub-elements of activities or resources that are involved in each of the six segments. In this version, all section labels are in title case, and the "Evaluate & Archive" segment has been updated to gold to increase accessibility.
RDM-lifecycle-2tier-v5-template.ai: Adobe Illustrator template can be used to customize the outer second tier text and the number of segments 2, 3, or 4, to meet the needs of different schools or data groups. Complete instructions for using the template can be found in the zip file included in version 2. These materials are licensed under a Creative Commons Attribution-NonCommercial 4.0 International License.