The Echelle Visualization Tool

Description
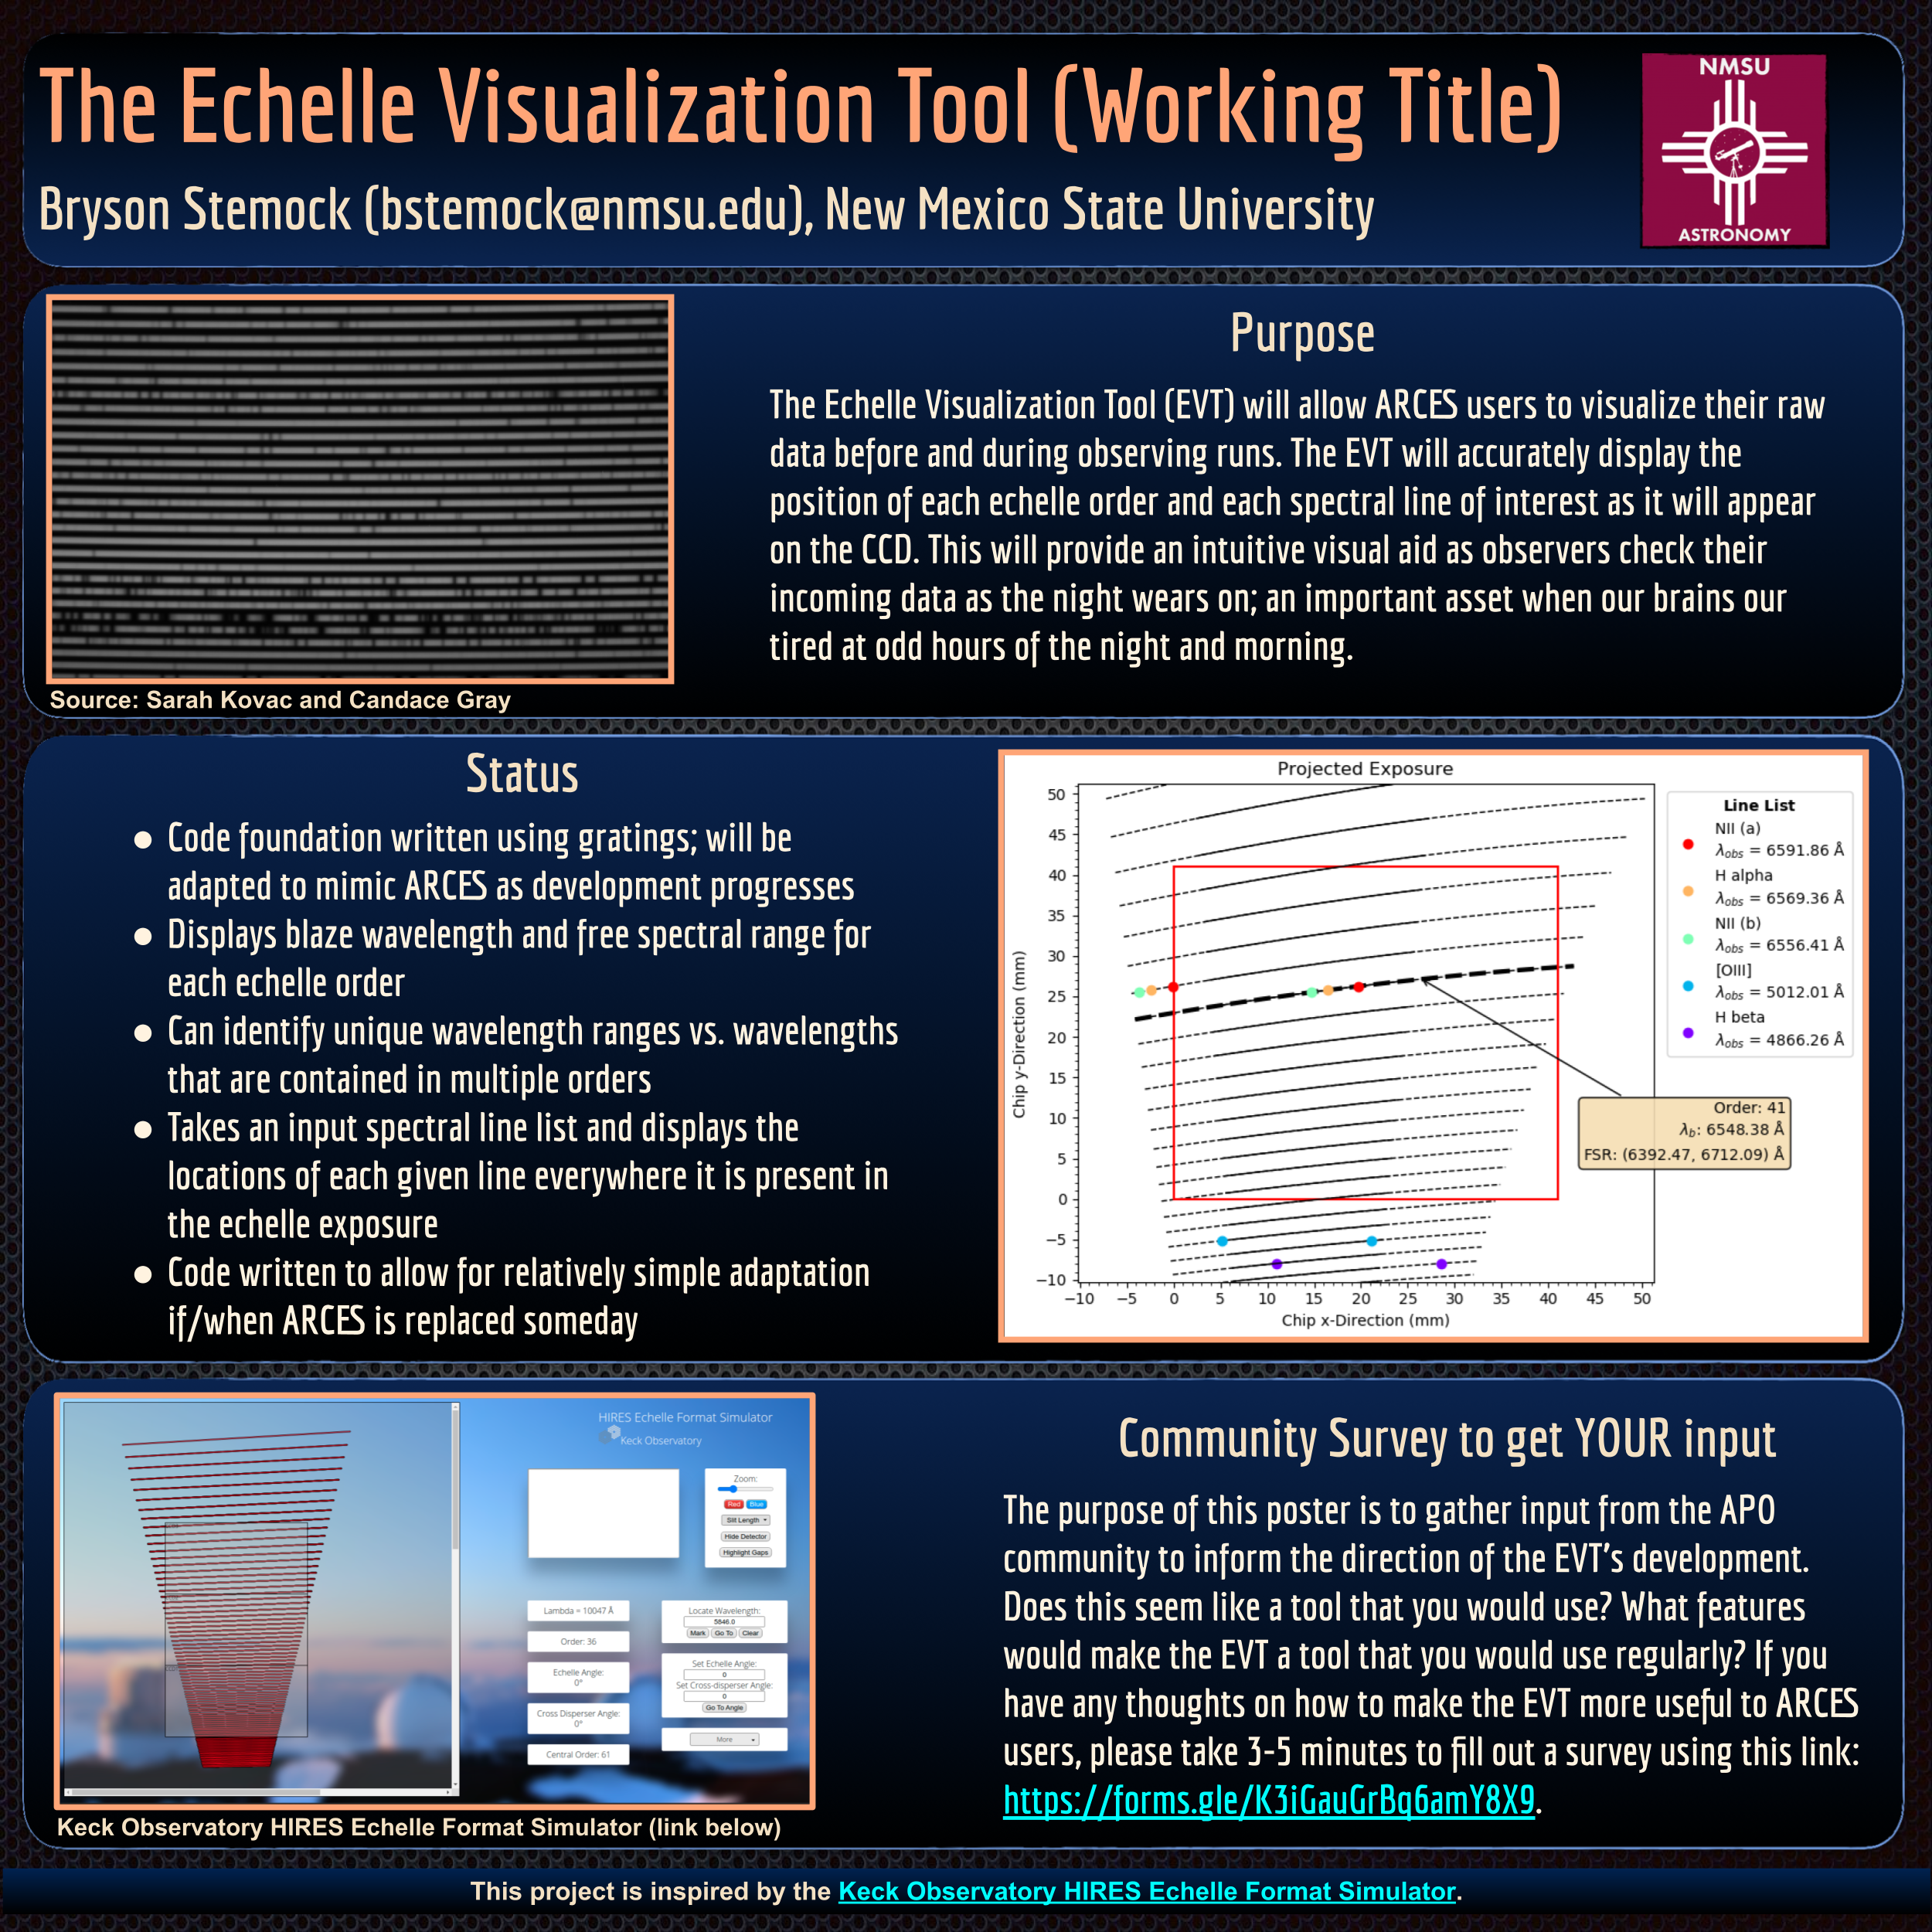
While many ARCES users are veteran observers who know what to expect when taking their data, newer users lack the intuition and experience to efficiently assess their raw data on the fly. Hence, I present a proof-of-concept version of the Echelle Visualization Tool (EVT). The EVT takes input parameters (variable and preset instrument characteristics) and outputs an interactive plot of the echelle orders as they would appear on the CCD. The EVT can also take an input line list to display the locations of spectral lines of interest on the CCD. Furthermore, the code for the EVT is written to minimize any adjustments that would need to be made in the event that ARCES is replaced by another echelle spectrograph. The intention of this project is not only to provide a planning tool that shows users what to expect during their observing run, but to facilitate precise yet uncomplicated count checks as data are taken throughout the night. The current version is not yet an accurate representation of ARCES. Rather, the purpose of this poster is to update the community and to gather feedback and requested features that will inform the development of the EVT moving forward. Feedback survey: https://forms.gle/eVLi7w5K2j525jfZA
Files
bstemock_poster_aposs21.pdf
Files
(5.6 MB)
| Name | Size | Download all |
|---|---|---|
|
md5:71c3959b0f31a5789926ccb95a6f412f
|
1.3 MB | Preview Download |
|
md5:19190fb82ad2de9588db8165fba807cd
|
4.3 MB | Preview Download |