Biodiversity Hotspots Map (English labels)

Description
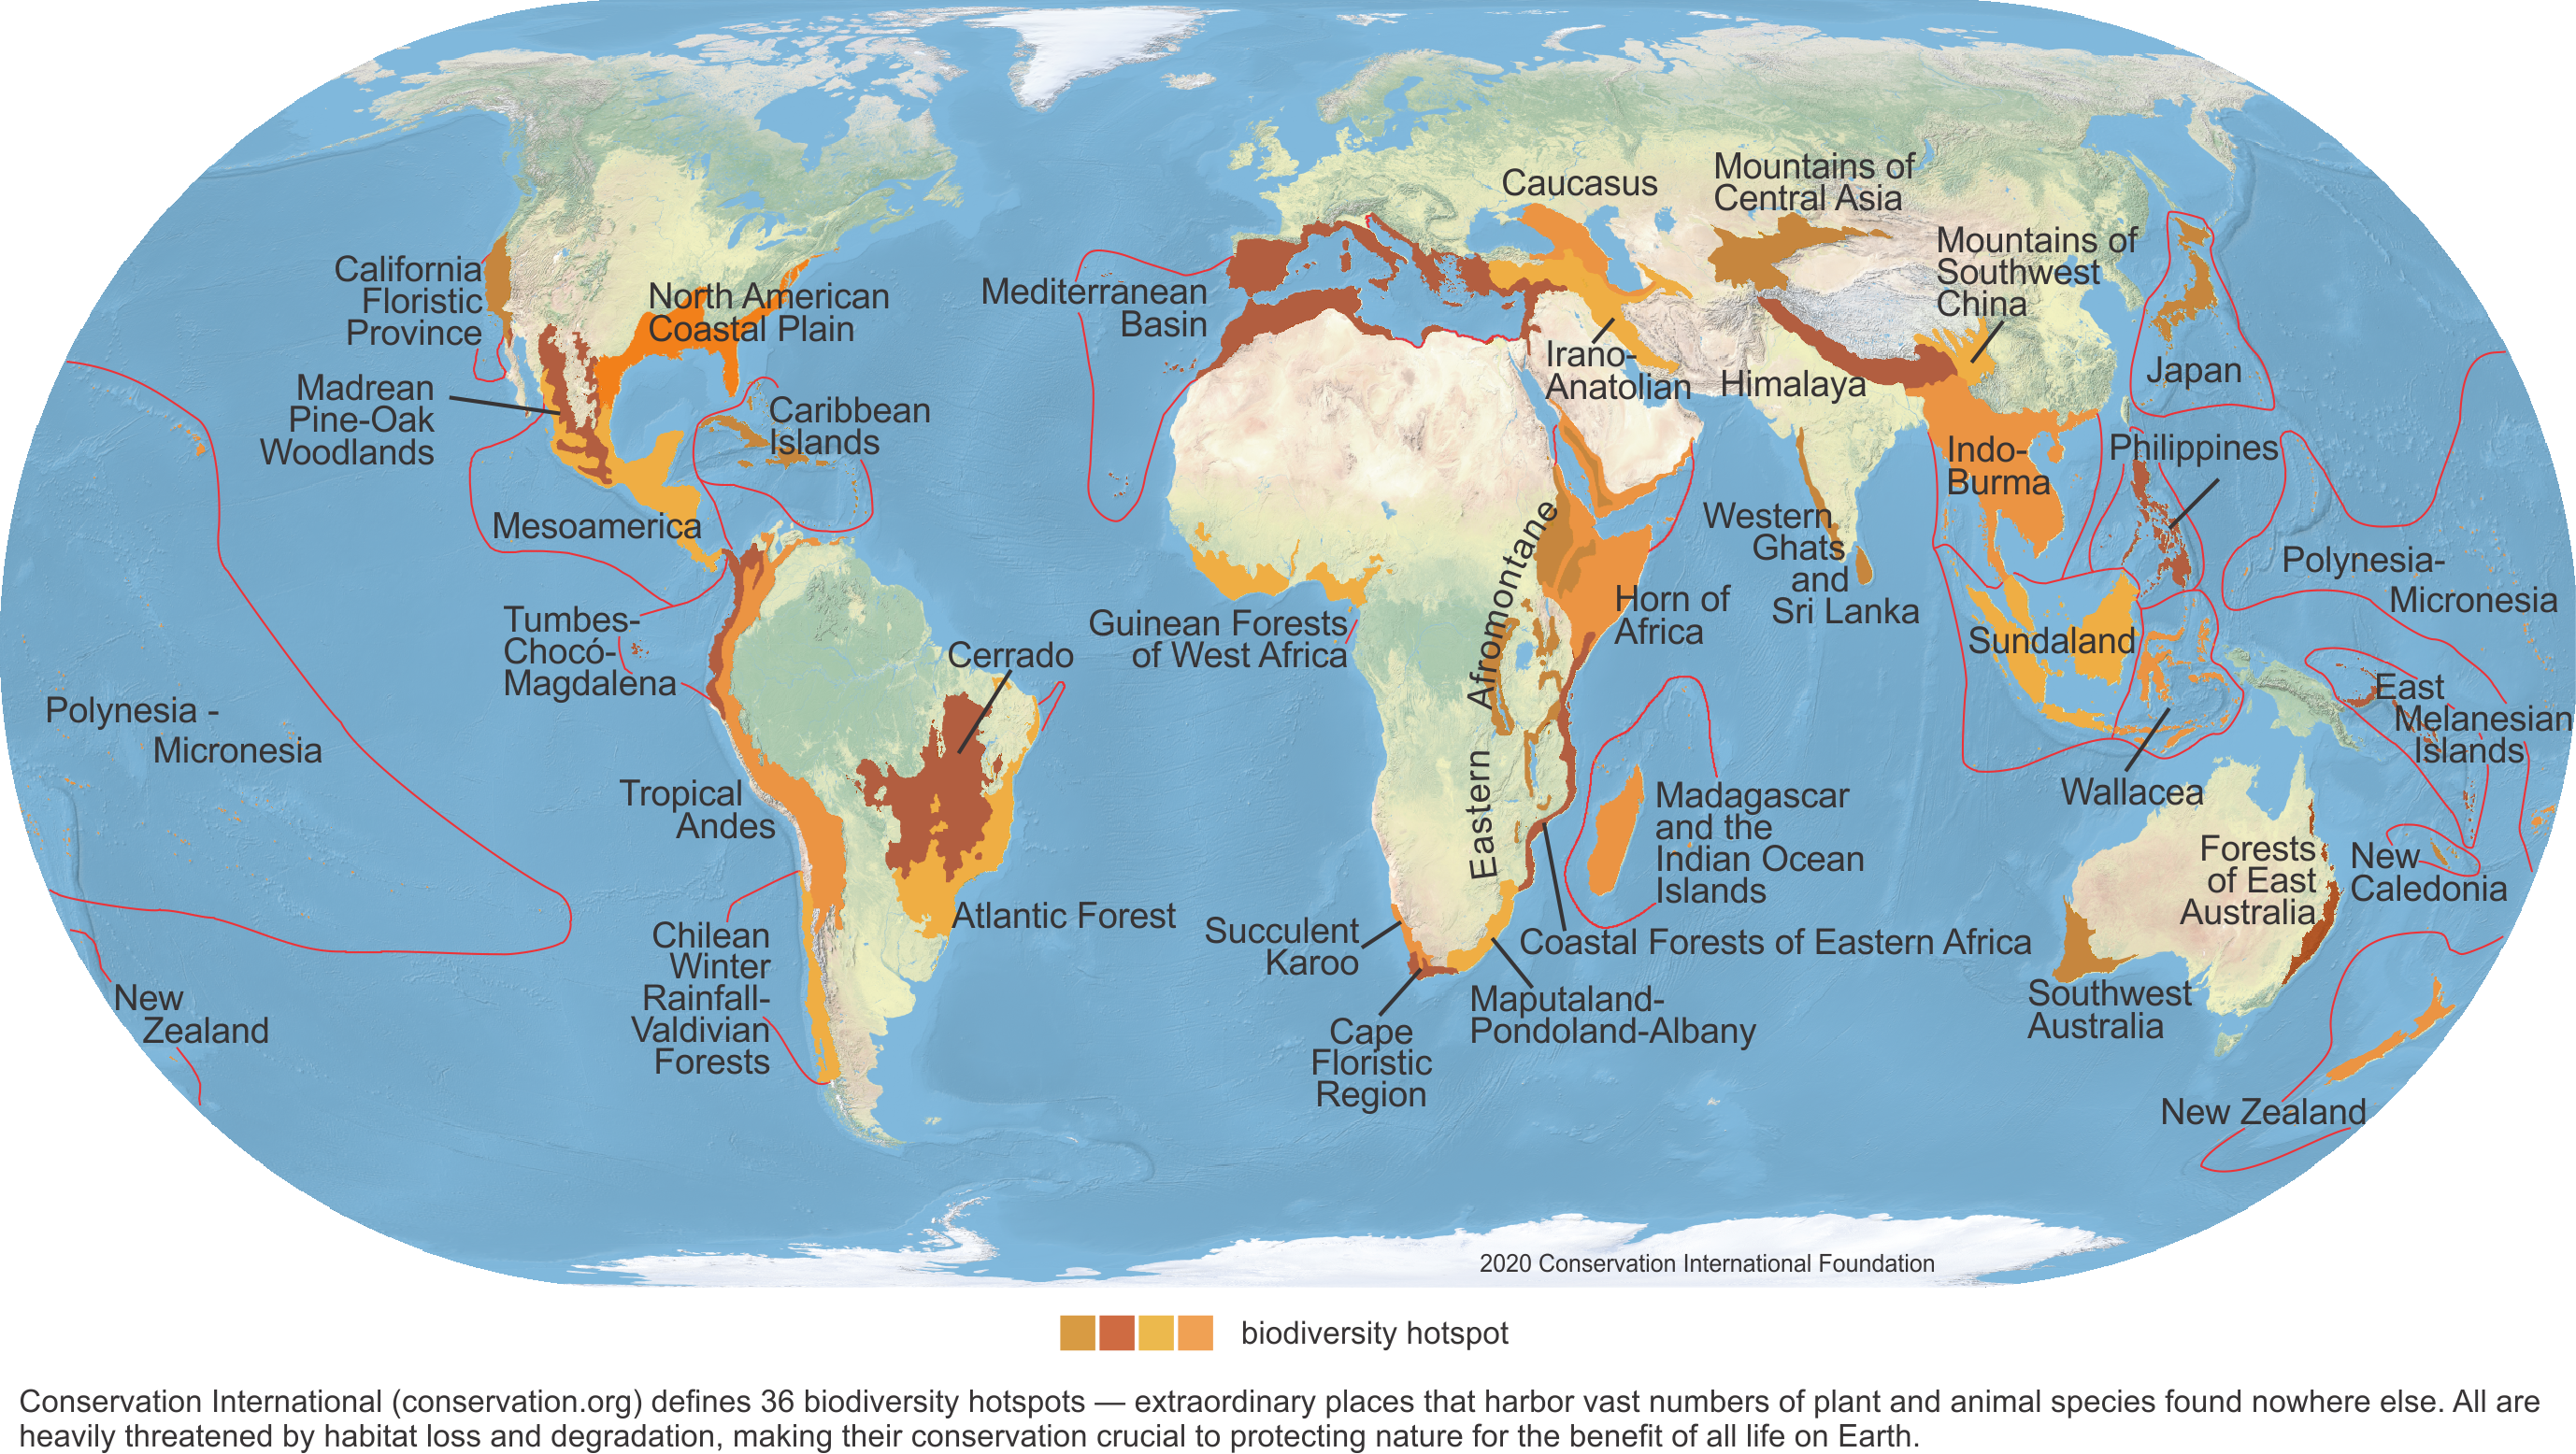
This map displays the global Biodiversity Hotspots 2016.1 dataset. The colors assigned to the hotspots are only used to distinguish adjacent hotspots and have no other meaning. The biodiversity hotspots represent terrestrial biodiversity only. The offshore lines are a cartographic device to group and highlight islands that are part of the same hotspots (e.g. Polynesia-Micronesia, Indo-Burma). The background image is from Natural Earth. This map is labelled with hotspot names in English; a version without text is also available: 10.5281/zenodo.4311831.
There are currently 36 recognized biodiversity hotspots. These are Earth’s most biologically rich—yet threatened—terrestrial regions.
To qualify as a biodiversity hotspot, an area must meet two strict criteria:
- Contain at least 1,500 species of vascular plants found nowhere else on Earth (known as "endemic" species).
- Have lost at least 70 percent of its primary native vegetation.
Many of the biodiversity hotspots exceed the two criteria. For example, both the Sundaland Hotspot in Southeast Asia and the Tropical Andes Hotspot in South America have about 15,000 endemic plant species. The loss of vegetation in some hotspots has reached a startling 95 percent.
Files
Biodiversity Hotspots_Labelled_2016_1.jpg
Additional details
Related works
- Is derived from
- Dataset: https://zenodo.org/record/3261807#.X8_HgNhKg2x (URL)