Figures S1-S7. SMR-HEIDI analysis results for 8q24.21 locus between BP and selected phenotypes.
Creators

- 1. Department of Twin Research and Genetic Epidemiology, King's College London, London, United Kingdom
- 2. Laboratory of Theoretical and Applied Functional Genomics, Novosibirsk State University, Novosibirsk, Russia; Laboratory of Recombination and Segregation Analysis, Institute of Cytology and Genetics SD RAS, Novosibirsk, Russia
- 3. Department of Twin Research and Genetic Epidemiology, King's College London, London, United Kingdom; Department of Molecular and Biological Physics, Moscow Institute of Physics and Technology (State University), Moscow, Russia; Research and Training Center on Bioinformatics, A.A. Kharkevich Institute for Information Transmission Problems, RAS, Moscow, Russia
- 4. Medical Genetics, Department of Medicine, University of Washington, Seattle, Washington, United States of America; Division of Rehabilitation Care Services, VA Puget Sound Health Care System, Seattle, Washington, United States of America
- 5. Laboratory of Recombination and Segregation Analysis, Institute of Cytology and Genetics SD RAS, Novosibirsk, Russia; Polyomica, 's-Hertogenbosch, the Netherlands
Description
Supplementary Figures S1-S7. SMR-HEIDI analysis results for rs6651255 between BP and selected phenotypes.
This project contains the following figures:
-
Figure S1. SMR-HEIDI analysis results for rs6651255 between BP and LDH.
-
Figure S2. SMR-HEIDI analysis results for rs6651255 between BP and GSDMC expression in skeletal muscle (GTEx v6).
-
Figure S3. SMR-HEIDI analysis results for rs6651255 between BP and FAM49B expression in Brain anterior cingulate cortex BA24 (GTEx v6).
-
Figure S4. SMR-HEIDI analysis results for rs6651255 between BP and FAM49B expression in CD8 cell line (CEDAR).
-
Figure S5. SMR-HEIDI analysis results for rs6651255 between BP and heel bone mineral density (UKBB).
-
Figure S6. SMR-HEIDI analysis results for rs6651255 between BP and disc problem phenotype (UKBB)
-
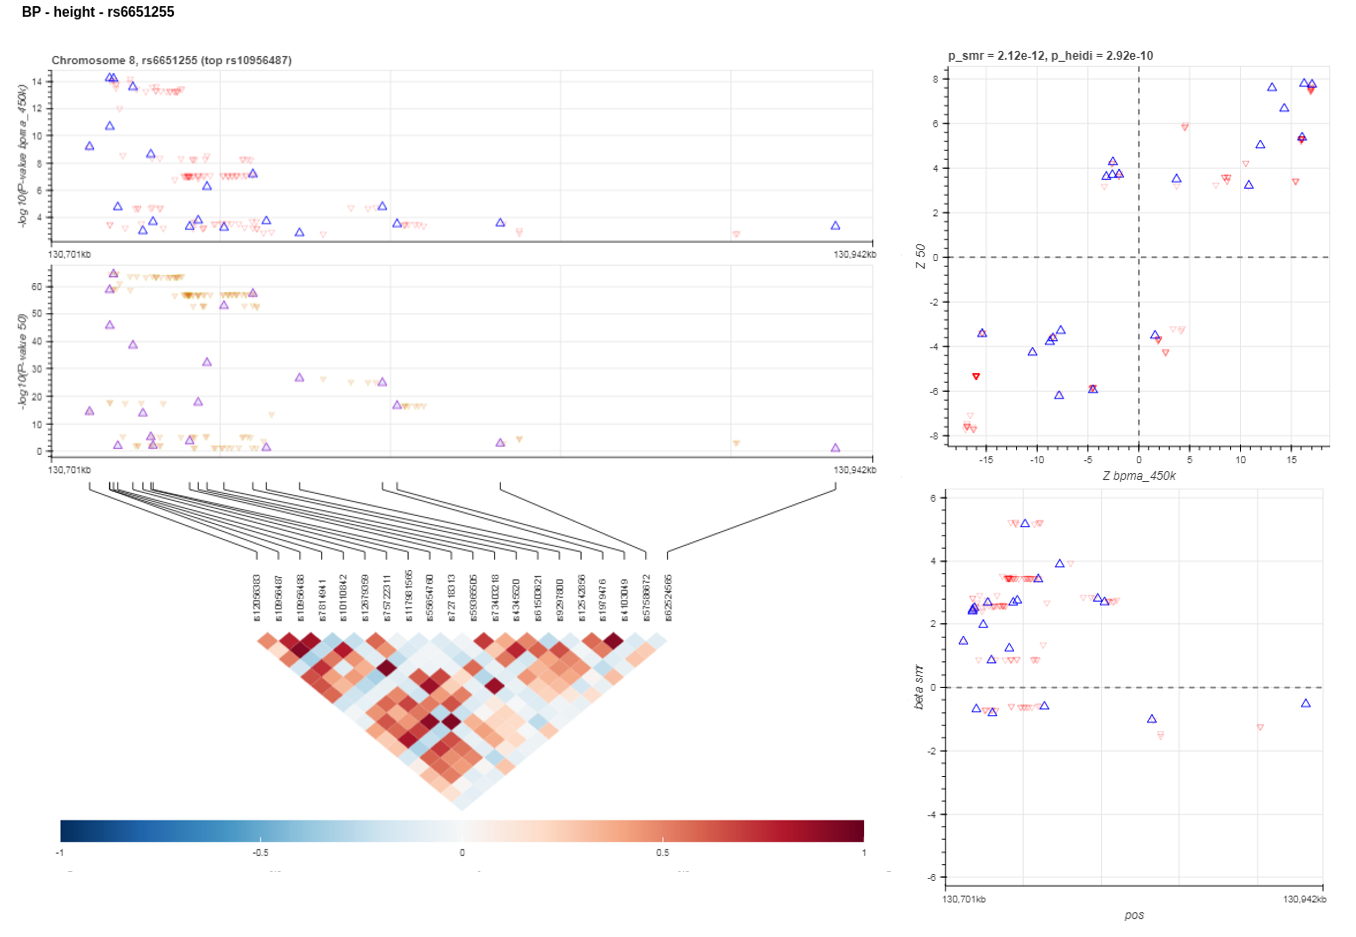
Figure S7. SMR-HEIDI analysis results for rs6651255 between BP and height (UKBB).
Figures legend:
Each figure consists of four parts (1 – top left; 2- top right; 3- bottom left; 4 – bottom right):
-
Regional association plots for GWAS-1 (in our case BP GWAS) and GWAS-2 (expression or complex trait). Blue triangles represent SNPs used to calculate HEIDI test. Crossed triangle is leading SNP for which SMR test was computed.
-
Z-Z plot (GWAS-1 on y-axis and GWAS-2 on x-axis).
-
Visualization of LD matrix for SNPs used in calculation of HEIDI test.
-
Plot of SMR regression coefficient estimates. The plot visualizes the heterogeneity of SMR coefficient. Blue color represents SNPs used to calculate HEIDI test.
Files
FigureS1.png
Files
(1.2 MB)
| Name | Size | Download all |
|---|---|---|
|
md5:f867608ef68f8c83143158e05e468331
|
86.5 kB | Preview Download |
|
md5:ee1a2b3f2ab686e2455d4c392b9703af
|
186.6 kB | Preview Download |
|
md5:c3b1ec1cdf6c857533d536afeef4e73d
|
165.2 kB | Preview Download |
|
md5:d54d2f85af422d29f7fdd437ae1affbb
|
174.3 kB | Preview Download |
|
md5:1e1fc83c6642cf7704494a21194425ce
|
179.1 kB | Preview Download |
|
md5:50a8eed37029bceb4a9eadc4234265e2
|
162.5 kB | Preview Download |
|
md5:99e39fa020a1e7ffa9470334fae87896
|
230.4 kB | Preview Download |
Additional details
Related works
- Is continued by
- Dataset: 10.5281/zenodo.3715027 (DOI)