Published October 4, 2022
| Version v1
Figure
Open
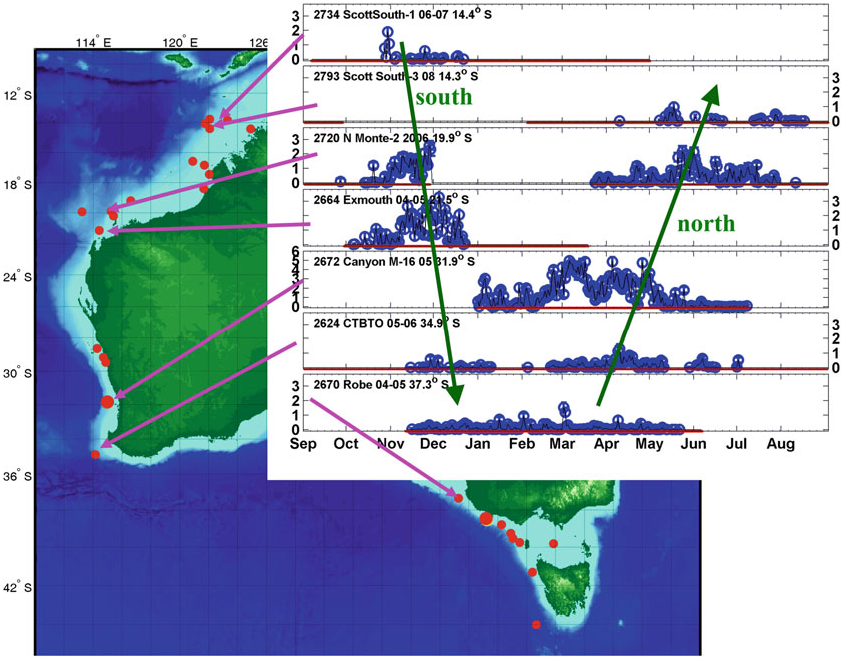
Fig. 7.20 in Analysis of Soundscapes as an Ecological Tool
- 1. Centre for Marine Science and Technology, Curtin University, Perth, WA, Australia
- 2. Centro Interdisciplinare di Bioacustica e Ricerche Ambientali, University of Pavia, Pavia, Italy
Description
Fig. 7.20 Seasonal timing of pygmy blue whale migration along the west and south coasts of Australia based on passive acoustic monitoring. The chart shows the locations of sound recordings (red dots). The diagram shows counts of pygmy blue whale singers as 24-h means. The red horizontal lines indicate when the recorders were operating (Erbe et al. 2016b)
Notes
Files
figure.png
Files
(666.7 kB)
| Name | Size | Download all |
|---|---|---|
|
md5:14860fa6fa4993df69ce11fc21b2135e
|
666.7 kB | Preview Download |
Linked records
Additional details
Related works
- Is part of
- Book chapter: 10.1007/978-3-030-97540-1_7 (DOI)
- Book chapter: urn:lsid:plazi.org:pub:510AFFBCD00BFFF8C31D624BFF93FF8D (LSID)
- Book chapter: https://zenodo.org/record/10475618 (URL)